

doi: 10.1002/ctm2.838.
Proteomic profiling of lung diffusion impairment in the recovery stage of SARS-CoV-2-induced ARDS
Affiliations
- PMID: 35538880
- PMCID: PMC9091985
- DOI: 10.1002/ctm2.838
Item in Clipboard
Proteomic profiling of lung diffusion impairment in the recovery stage of SARS-CoV-2-induced ARDS
Clin Transl Med.
2022 May.
No abstract available
Conflict of interest statement
The authors declare that they have no competing interests.
Figures
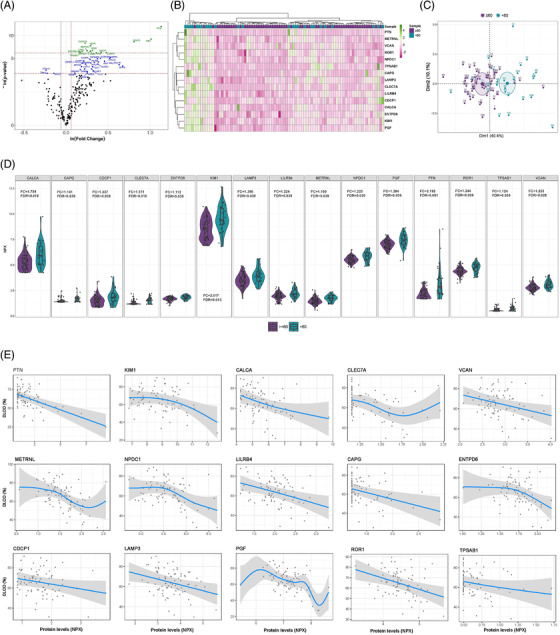
Differentially detected proteins according to the severity of lung diffusion impairment in survivors of ARDS secondary to SARS‐CoV‐2 infection. (A) Volcano plot showing the p‐value versus the fold change for each detected protein. Blue dots indicate significantly detected proteins considering a p‐value < 0.05. Green dots reflect significantly detected proteins with an FDR < 0.05. The FDR was obtained using the Benjamini–Hochberg method. (B) Heatmap representing unsupervised hierarchical clustering. Each column represents a survivor. Each row represents a differentially detected protein. The patient clustering tree is plotted on top. The protein clustering is shown on the left. Protein levels are represented through a colour scale, with green tones related to increasing levels and pink tones related to decreasing expression. (C) Principal component analysis using differentially detected proteins. Each point denotes a survivor and is represented with a specific colour depending on the presence or absence of severe diffusion impairment. (D) Violin plots of differentially detected proteins. Fold change (FC) and FDR are plotted for each protein. (E) Generalised additive model (GAM) with penalized cubic regression splines for D
LCO (Y axis) and the levels of each of the differentially detected proteins (NPX) (X axis). The association was adjusted by age, sex, previous chronic pulmonary disease, smoking history, the use of corticoids after hospital discharge and glomerular filtration. All proteins included in the analysis showed an FDR < 0.05
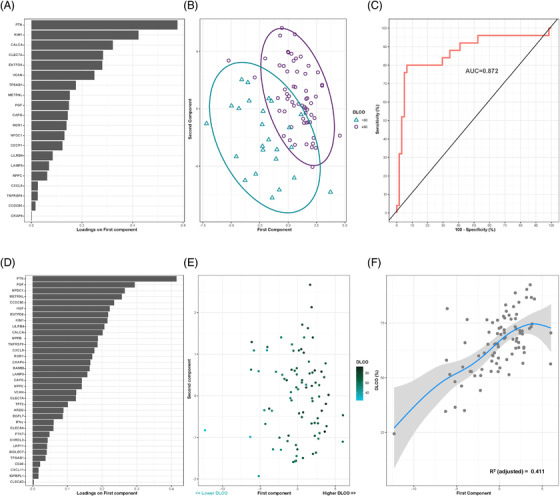
Plasma proteomic signatures associated with moderate/severe diffusion impairment and D
LCO levels in survivors of ARDS secondary to SARS‐CoV‐2 infection. (A) Proteins are ranked by their variable importance to component 1. (B) Supervised component analysis cluster through sparse partial least‐squares discriminant analysis (sPLS‐DA) discriminating between survivors with moderate/severe diffusion impairment (DLCO < 60%) and survivors with mild or an absence of alterations in diffusion capacity survivors (DLCO≥60%). Each point represents a patient. (C) Receiver operating characteristic (ROC) curve for the protein signature. The discriminative power of the signature is represented as the area under the ROC curve (AUC). (D) Proteins ranked by their variable importance for component 1. (E) Supervised component analysis cluster through sPLS according to the D
LCO levels of the cohort. Each protein represents a survivor. (F) Generalized additive model (GAM) with penalized cubic regression splines for D
LCO (Y axis) and the first component (X axis). The significance of the association is given by the coefficient of determination (R
2)
References
Publication types
MeSH terms
LinkOut - more resources
Full Text Sources
Medical
Miscellaneous