

doi: 10.1002/ctm2.846.
Loss of exosomal miR-26a-5p contributes to endometrial cancer lymphangiogenesis and lymphatic metastasis
Affiliations
- PMID: 35538902
- PMCID: PMC9092006
- DOI: 10.1002/ctm2.846
Item in Clipboard
Loss of exosomal miR-26a-5p contributes to endometrial cancer lymphangiogenesis and lymphatic metastasis
Clin Transl Med.
2022 May.
No abstract available
Conflict of interest statement
The authors declare that no conflict of interests.
Figures
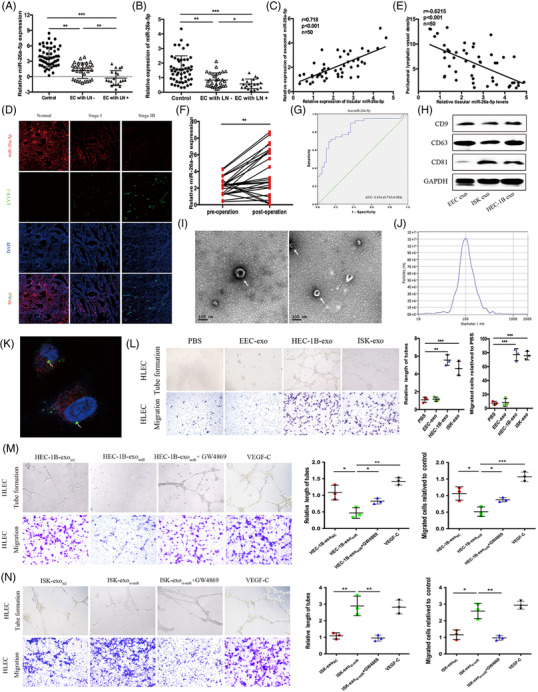
Plasma exosomal miR‐26a‐5p is associated with LNM in EC patients, and miR‐26a‐5p transferred to HLECs promotes lymphangiogenesis in vitro. (A) qRT‐PCR analysis to detect plasma exosomal miR‐26a‐5p levels in healthy controls and EC patients. EC with LN‐: endometrial cancer with lymph node negative; EC with LN+: endometrial cancer with lymph node positive. (B) qRT‐PCR analysis of miR‐26a‐5p expression in normal endometrial tissue and EC tissue. (C) Pearson correlation analysis between miR‐26a‐5p levels of EC tissues and miR‐26a‐5p levels of plasma exosomes from EC patients. (D) FISH images of miR‐26a‐5p and LYVE‐1 in paraffin‐embedded normal endometrial tissue and EC tissue with or without LNM. (E) Pearson correlation between miR‐26a‐5p expression and LYVE‐1 expression in EC tissue. (F) Comparison of plasma exosomal miR‐26a‐5p levels (n = 25) between pre‐operative and post‐operative EC patients. (G) ROC curve analyses to evaluate the potential of plasma exosomal miR‐26a‐5p for diagnosis of LNM in EC patients. (H‐J) Purified exosomes were identified via western blot, transmission electron microscopy, and NanoSight analysis. (K) Representative images of Cy3 and PKH67 fluorescence in HLECs after a 48 h exposure to HEC‐1B cell‐derived PKH67‐labelled exosomes. (L) Representative images of tube formation and cell migration of HLECs after treatment with PBS, and exo. (M) Micrographs of tube formation and cell migration in HLECs treated with HEC‐1B‐exoNC, HEC‐1B‐exomiR, HEC‐1B‐exomiR+GW4869 or VEGF‐C, VEGF‐C as a positive control for HEC‐1B‐exomiR treatment. (N) Micrographs of tube formation and cell migration in HLECs treated with ISK‐exoNC, ISK‐exosi‐miR, ISK‐exosi‐miR+GW4869 or VEGF‐C, VEGF‐C as a positive control for ISK‐exosi‐miR treatment. Mean ± SD are provided. *p < .05, **p < .01, ***p < .001
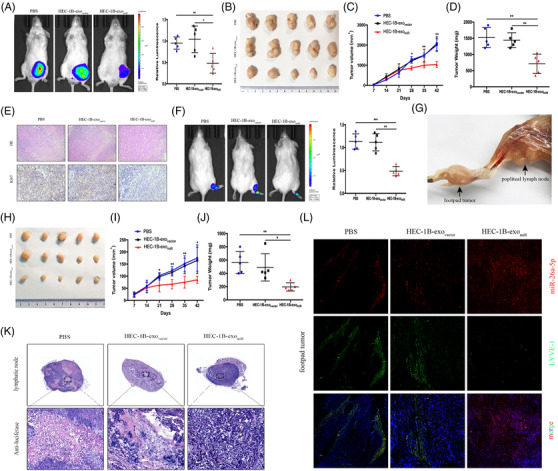
Exosomal miR‐26a‐5p inhibits EC tumour proliferation and LNM in vivo. (A) Representative bioluminescence images and histogram analysis of subcutaneous tumours in NOD‐SCID mice, which treated with PBS, HEC‐1B‐exovector, or HEC‐1B‐exomiR (n = 5). (B) Images of subcutaneous tumours in mice treated with PBS, HEC‐1B‐exovector, or HEC‐1B‐exomiR (n = 5). (C, D) The tumour volumes and weights (n = 5). (E) Representative HE and immunohistochemical staining images demonstrating Ki67 expression. (F) Bioluminescence images and analysis of popliteal metastatic lymph node in NOD‐SCID mice, which treated with PBS, HEC‐1B‐exovector, or HEC‐1B‐exomiR after HEC‐1B cell inoculation into the footpad (n = 5). (G) Representative image of the popliteal lymph node. (H) Representative images of footpad tumours. (I, J) The measured footpad tumour volumes and weights (n = 5). (K) IHC of anti‐luciferase for popliteal lymph node treated with PBS or the indicated exosomes. Luciferase‐positive tumour cell in lymph node indicated metastasis. (L) Staining of miR‐26a‐5p and LYVE‐1 mice footpad tumour sections. Mean ± SD are provided. *p < .05, **p < .01, ***p < .001
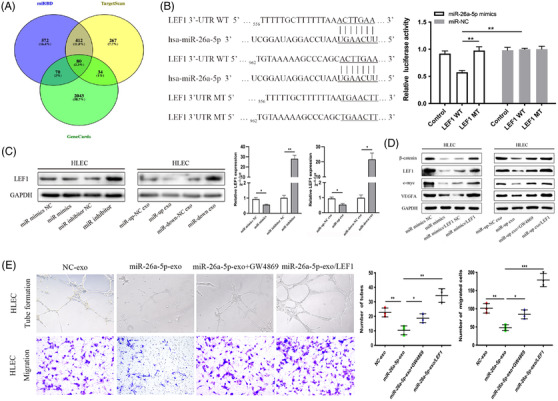
EC‐secreted exosomal miR‐26a‐5p targets LEF1 induced lymphatic vessel formation in HLECs. (A) miR‐26a‐5p target predictions identified from different databases (miRDB, TargetScan and GeneCards). (B) Sequence alignment between miR‐26a‐5p and the 3′‐UTR of LEF1 (left), and effects of miR‐26a‐5p mimics/NC on the luciferase reporter activity in wild type (WT) and mutant type (MT) (right). (C) Protein and mRNA levels of LEF1 assessed through western blotting and qRT‐PCR, respectively, in HLECs, after transfection with miR‐26a‐5p mimics/inhibitor or indicated exosomes. (D) β‐catenin, LEF1, c‐myc and VEGFA protein levels were detected by western blotting in HLECs treated with an miR‐26a‐5p mimics, indicated exosomes from GW4869‐pre‐treated EC cells, or in the presence of LEF1 overexpression plasmid. (E) Upregulation of LEF1 reversed the biological effects of exosomal miR‐26a‐5p, as evaluated by tube formation and cell migration experiments. Mean ± SD are provided (n = 3). *p < .05, **p < .01, ***p < .001
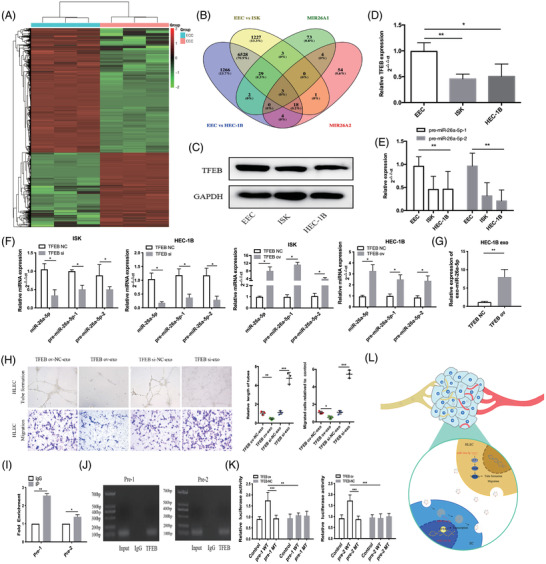
Transcription factor EB controls miR‐26a‐5p expression levels. (A) Heatmap of differentially expressed mRNAs between EEC and EC cells. ECC: endometrial cancer cell; EEC: endometrial epithelial cells. (B) The intersection between differential mRNAs and putative direct transcription factors of miR‐26a‐5p, as predicted by the JASPAR database. MIR26A1: the predicted transcription factors of pre‐1; MIR26A2: the predicted transcription factors of pre‐2. (C, D) Protein and mRNA levels of TFEB in EC and EEC cells respectively. (E) pre‐1 and pre‐2 levels in EC cells and EEC cells. (F) Levels of miR‐26a‐5p, pre‐1, and pre‐2 after TFEB overexpression/downexpression plasmids were transfected into EC cells. (G) mRNA levels of miR‐26a‐5p in HEC‐1B‐derived exosomes after transfection with TFEB overexpression plasmid. (H) Representative pictures of cell migration and tube formation in HLECs treated with HEC‐1B‐derived exosomes after transfection with TFEB overexpression/downexpression plasmids, compared with that in HLECs treated with NC‐exo. (I) The relative expression of segments containing TFEB binding sites detected via qRT‐PCR following ChIP assay. (J) Southern blot of indicated segments with anti‐TFEB antibody following ChIP assay. (K) Relative luciferase activity of pre‐1 and pre‐2 in HEC‐1B after transfection with luciferase reporter including wild type (WT) or mutant type (MT). (L) Illustrative model of EC cell‐secreted exosomal miR‐26a‐5p absorbed by HLECs and associated promotion of lymphangiogenesis via activation of the LEF1/c‐myc/VEGFA axis. Mean ± SD are provided (n = 3). *p < .05, **p < .01, ***p < .001
Similar articles
-
Identification of microRNAs associated with lymphangiogenesis in human gastric cancer.Clin Transl Oncol. 2014 Apr;16(4):374-9. doi: 10.1007/s12094-013-1081-6. Epub 2013 Jul 24. Clin Transl Oncol. 2014. PMID: 23881463
-
Exosomal lncRNA NEAT1 from cancer-associated fibroblasts facilitates endometrial cancer progression via miR-26a/b-5p-mediated STAT3/YKL-40 signaling pathway.Neoplasia. 2021 Jul;23(7):692-703. doi: 10.1016/j.neo.2021.05.004. Epub 2021 Jun 18. Neoplasia. 2021. PMID: 34153644 Free PMC article.
-
MicroRNA-129-5p suppresses nasopharyngeal carcinoma lymphangiogenesis and lymph node metastasis by targeting ZIC2.Cell Oncol (Dordr). 2020 Apr;43(2):249-261. doi: 10.1007/s13402-019-00485-5. Epub 2019 Dec 28. Cell Oncol (Dordr). 2020. PMID: 31884576
-
Lymphangiogenesis, lymphatic systemomics, and cancer: context, advances and unanswered questions.Clin Exp Metastasis. 2018 Aug;35(5-6):419-424. doi: 10.1007/s10585-018-9907-9. Epub 2018 May 28. Clin Exp Metastasis. 2018. PMID: 29808352 Review.
-
NRP-2 in tumor lymphangiogenesis and lymphatic metastasis.Cancer Lett. 2018 Apr 1;418:176-184. doi: 10.1016/j.canlet.2018.01.040. Epub 2018 Jan 12. Cancer Lett. 2018. PMID: 29339213 Review.
Cited by
-
New insights for gynecological cancer therapies: from molecular mechanisms and clinical evidence to future directions.Cancer Metastasis Rev. 2023 Sep;42(3):891-925. doi: 10.1007/s10555-023-10113-2. Epub 2023 Jun 27. Cancer Metastasis Rev. 2023. PMID: 37368179 Free PMC article. Review.
-
Tumor suppressor genes are reactivated by miR-26A1 via enhancer reprogramming in NSCLC.Hum Mol Genet. 2023 Jan 1;32(1):79-92. doi: 10.1093/hmg/ddac185. Hum Mol Genet. 2023. PMID: 35921230 Free PMC article.
-
The role of ncRNAs and exosomes in the development and progression of endometrial cancer.Front Oncol. 2024 Aug 12;14:1418005. doi: 10.3389/fonc.2024.1418005. eCollection 2024. Front Oncol. 2024. PMID: 39188680 Free PMC article. Review.
-
The Role and Applications of Exosomes in Gynecological Cancer: A Review.Cell Transplant. 2023 Jan-Dec;32:9636897231195240. doi: 10.1177/09636897231195240. Cell Transplant. 2023. PMID: 37632354 Free PMC article. Review.
-
Advances in peptides encoded by non-coding RNAs: A cargo in exosome.Front Oncol. 2022 Dec 23;12:1081997. doi: 10.3389/fonc.2022.1081997. eCollection 2022. Front Oncol. 2022. PMID: 36620552 Free PMC article. Review.
References
-
- Siegel RL, Miller KD, Fuchs HE, et al. Cancer statistics, 2022. CA Cancer J Clin. 2022;72(1):7‐33. - PubMed
-
- Alitalo K, Tammela T, Petrova TV. Lymphangiogenesis in development and human disease. Nature. 2005;438(7070):946‐953. - PubMed
-
- Achen MG, McColl BK, Stacker SA. Focus on lymphangiogenesis in tumor metastasis. Cancer Cell. 2005;7(2):121‐127. - PubMed
-
- Nedaeinia R, Manian M, Jazayeri MH, et al. Circulating exosomes and exosomal microRNAs as biomarkers in gastrointestinal cancer. Cancer Gene Ther. 2017;24(2):48‐56. - PubMed
Publication types
MeSH terms
Substances
LinkOut - more resources
Full Text Sources