Review
. 2019 Nov 13;9(63):37009-37051.
doi: 10.1039/c9ra06678k. eCollection 2019 Nov 11.

Recent advances in metallopolymer-based drug delivery systems

Affiliations
Review

Recent advances in metallopolymer-based drug delivery systems

Gulzhian I Dzhardimalieva et al. RSC Adv. .

Abstract

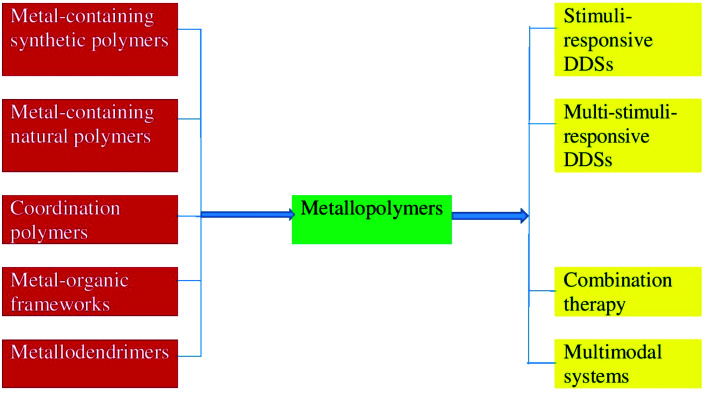
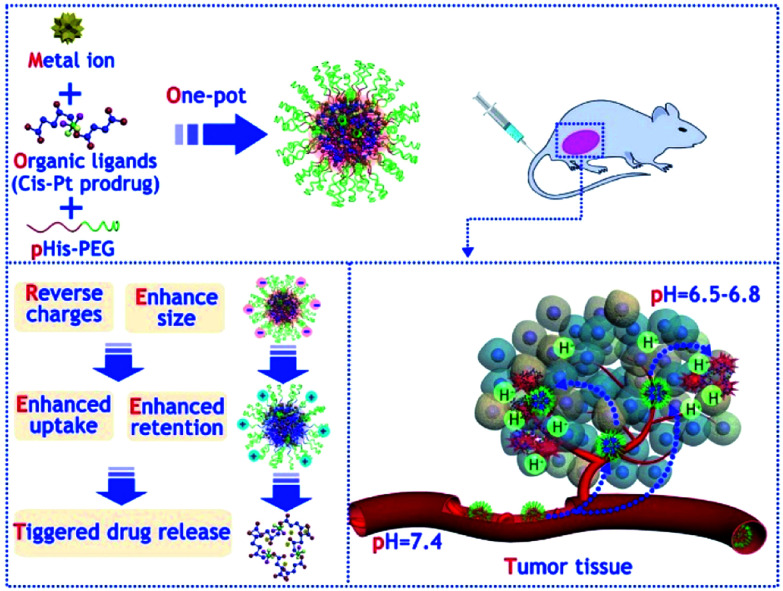
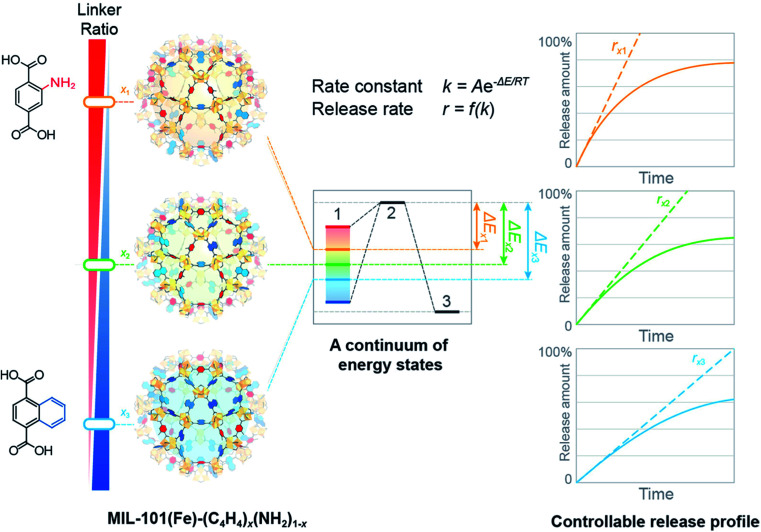
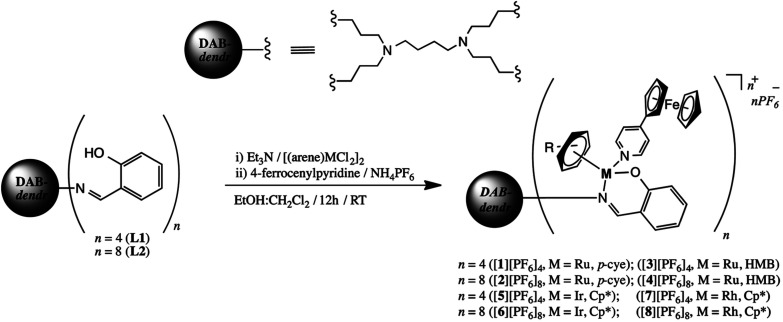
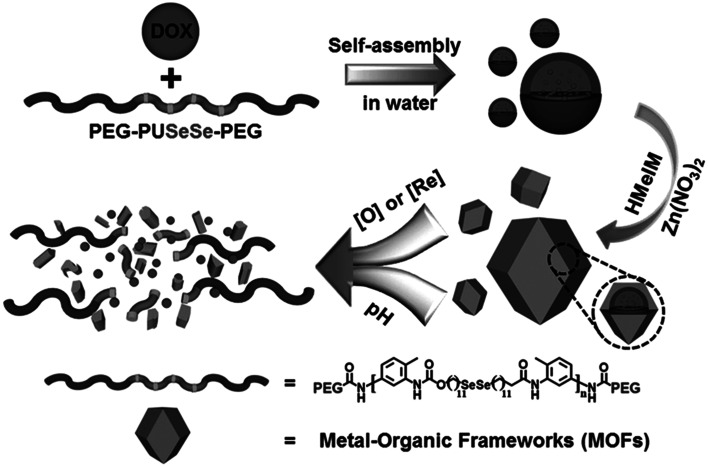
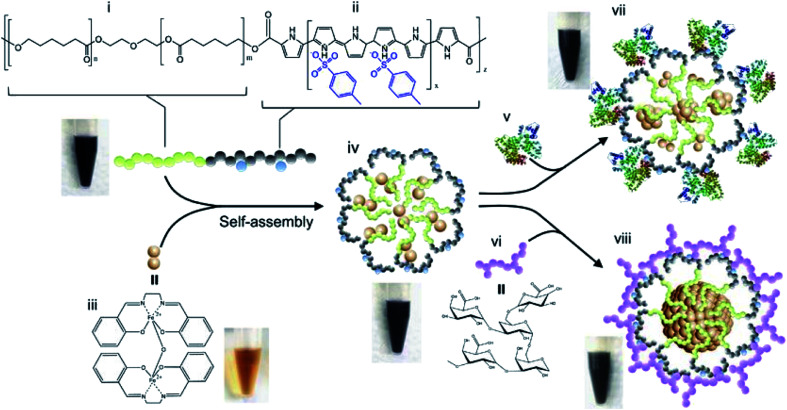
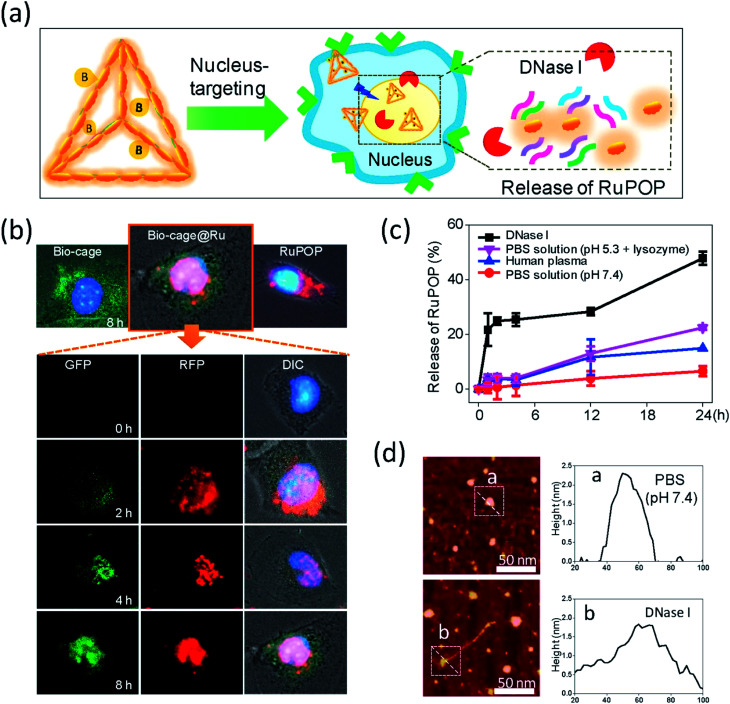
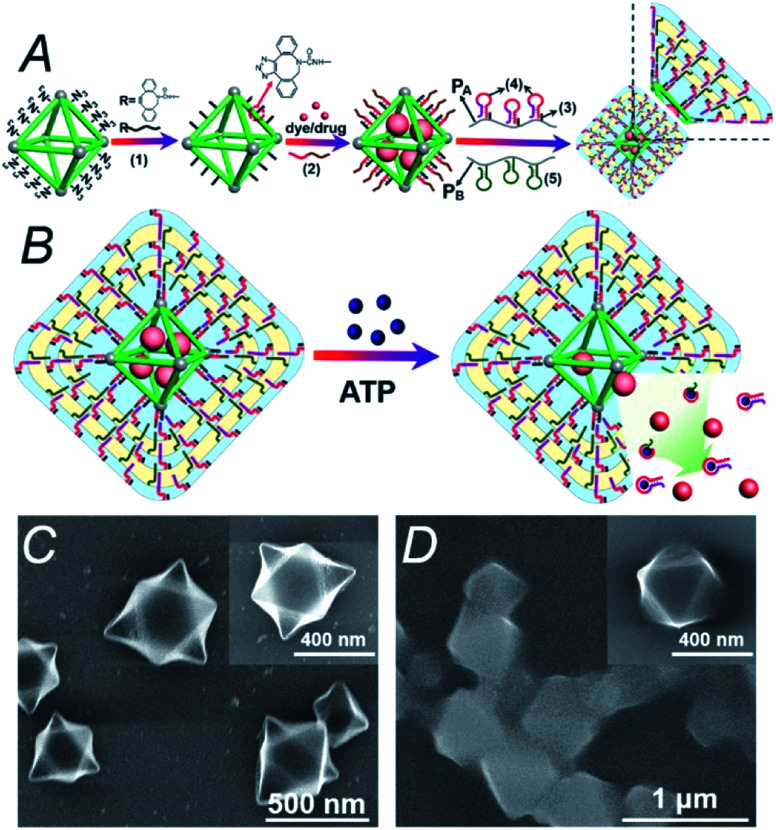
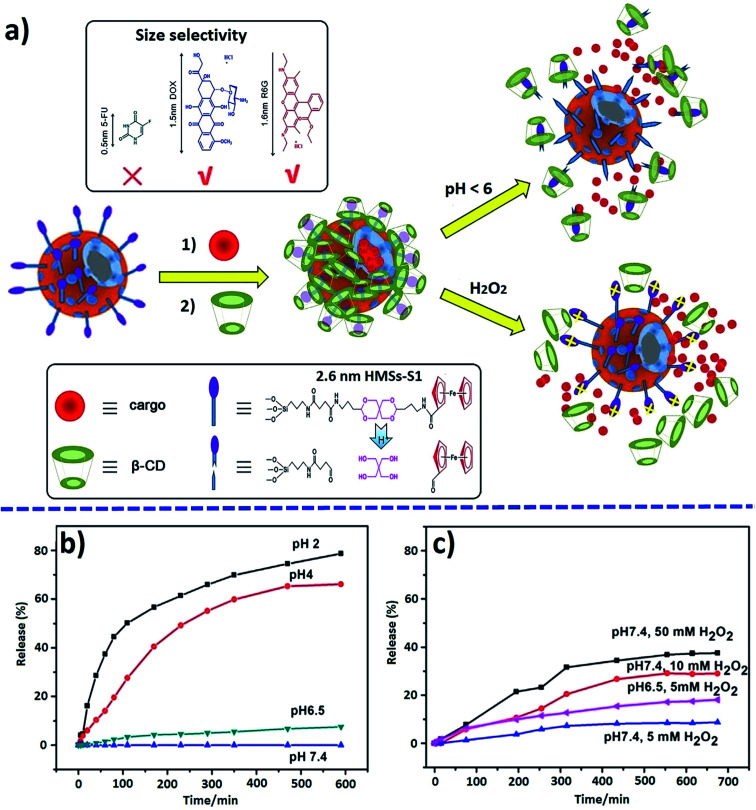
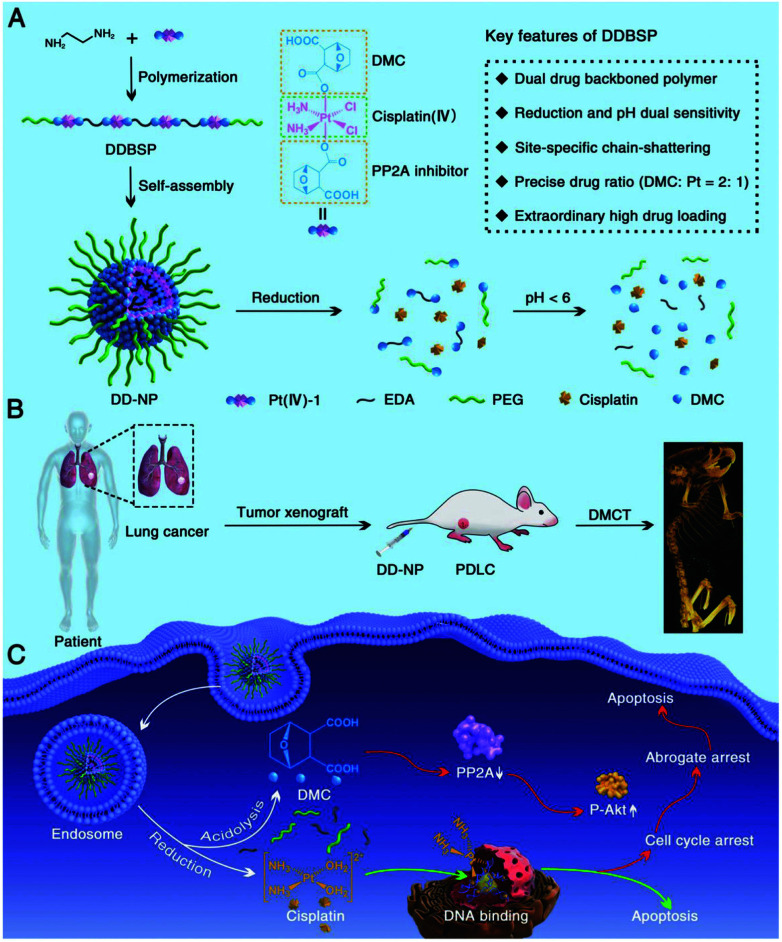
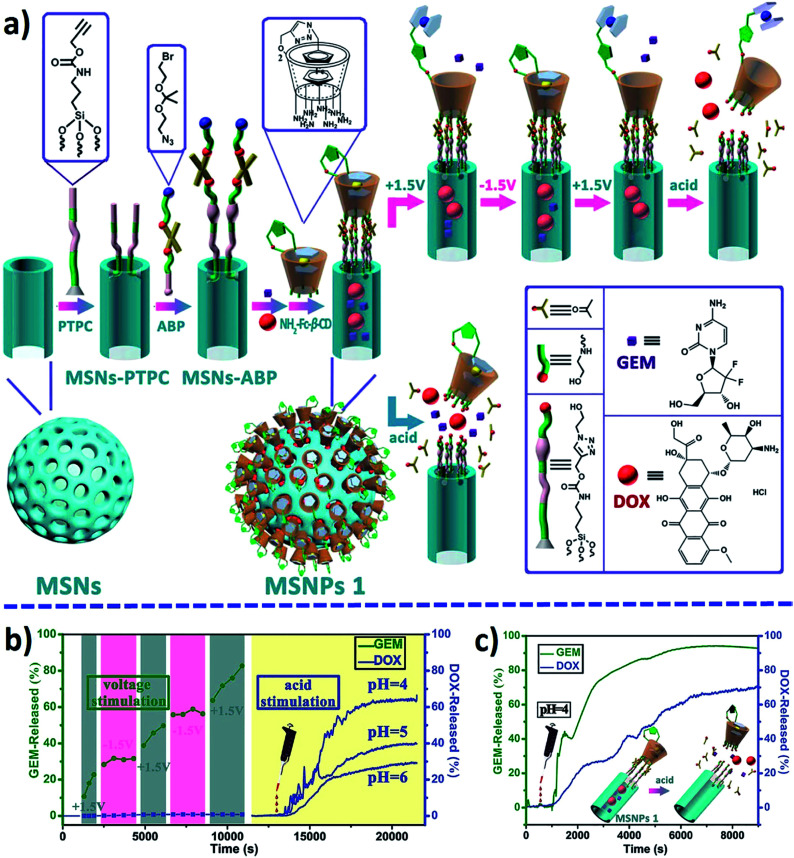
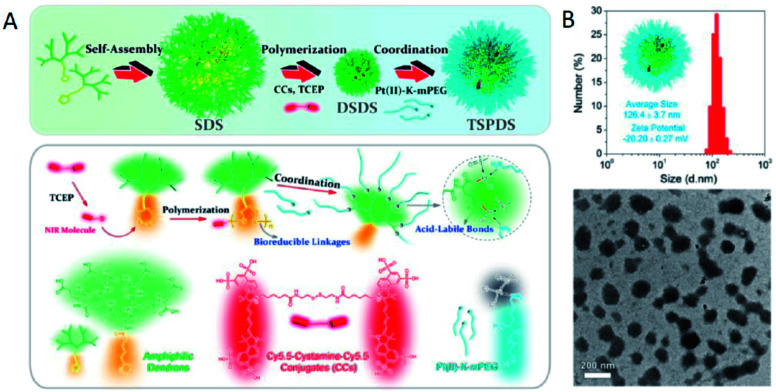
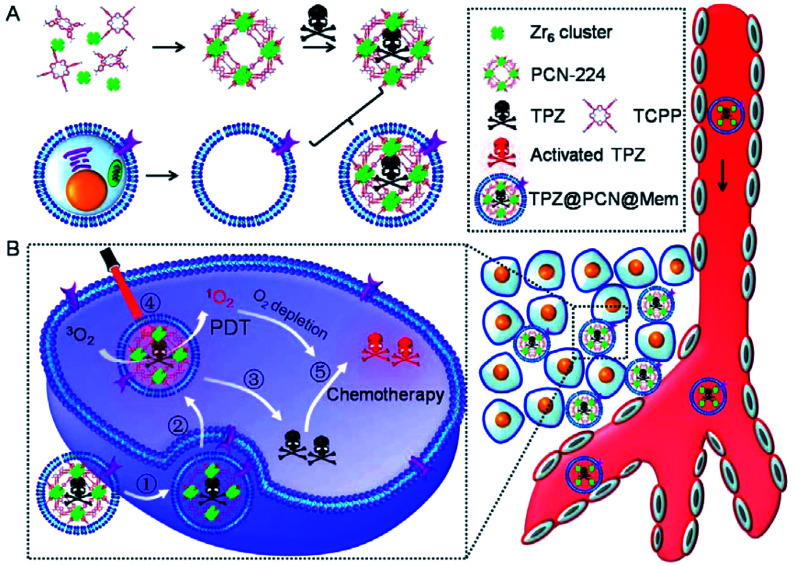
Metallopolymers (MPs) or metal-containing polymers have shown great potential as new drug delivery systems (DDSs) due to their unique properties, including universal architectures, composition, properties and surface chemistry. Over the past few decades, the exponential growth of many new classes of MPs that deal with these issues has been demonstrated. This review presents and assesses the recent advances and challenges associated with using MPs as DDSs. Among the most widely used MPs for these purposes, metal complexes based on synthetic and natural polymers, coordination polymers, metal-organic frameworks, and metallodendrimers are distinguished. Particular attention is paid to the stimulus- and multistimuli-responsive metallopolymer-based DDSs. Of considerable interest is the use of MPs for combination therapy and multimodal systems. Finally, the problems and future prospects of using metallopolymer-based DDSs are outlined. The bibliography includes articles published over the past five years.


Conflict of interest statement

No potential conflict of interest was reported by the authors.

Figures

Fig. 1
Fig. 1. Structural representations of Wolf Type I–III metallopolymers.
Fig. 2
Fig. 2. Classification of the methods for the synthesis of metallopolymers of Type I and II.
Fig. 3
Fig. 3. The main strategies and approaches, synthetic methodologies and post-synthetic transformations of coordination polymers.
Fig. 4
Fig. 4. The main types of metallopolymers-based DDSs, as well as use MPs as stimuli- and multistimuli-responsive DDSs, for combination therapy and as multimodal systems.
Fig. 5
Fig. 5. (left) HT1080 tumor growth profile during treatment; (right) pie chart showing the distribution of nuclear DOX accumulation in orthotopic ovarian tumors and key organs associated with toxicity [reprinted from ref. 141 under a Creative Commons Attribution 4.0 International License].
Fig. 6
Fig. 6. Antiproliferative activity of free organoiridium complex, drug-bearing polymer and drug-bearing conjugate in A2780 (cancer, dark) and HOF (healthy, light) ovarian cells. **p < 0.01, ***p < 0.001 [reprinted with permission from ref. 142. Copyright 2018 American Chemical Society].
Fig. 7
Fig. 7. Pt(iv) drugs as crosslinking agents of NPs. Self-assembly of bis(mPEG-b-PLA)-Pt(iv) conjugates in micelles [reprinted with permission from ref. 143. Copyright 2015, American Chemical Society].
Fig. 8
Fig. 8. (A) The chemical structure of the Pt(ii)-NLS hybrid. (B) Viability of platinum-sensitive (left) and resistant (right) cells after 72 h incubation with Pt(ii)-NLS hybrid and controls. *Each column represents the mean and standard deviation of N = 3 and p < 0.005 [reprinted with permission from ref. 147. Copyright 2018, American Chemical Society].
Fig. 9
Fig. 9. (left) Pt(ii)-linker re-bridges the antibody chains with a strong Pt–S interaction, giving stability, homogeneity and site-specificity. (right) In vivo efficacy in animals treated with Ctx–Pt–PEG–CPT (Ctx is cetuximab and CPT is camptothecin) showed significant differences in tumor volume compared with the control group (P < 0.016), with TGI of 55% [reprinted from ref. 148 with permission from The Royal Society of Chemistry].
Fig. 10
Fig. 10. Synthetic pathways to the HA-EDA–Pt(iv) nanoconjugate, HA-EDA–Pt(iv)–TRITC, and HA-EDA–Pt(iv)–Cy7, SE [reprinted from ref. 151 with permission from The Royal Society of Chemistry].
Fig. 11
Fig. 11. Preparation and characterization of CP-1/siRNAs. (A) Schematic representation of CP-1/siRNAs carrying cisplatin in the solid core and siRNAs in the lipid shell. (B) Transmission electron microscopy (TEM) image of CP-1/siRNAs showing the spherical and monodispersed nanostructure. Bar = 100 nm. (C) siRNA release from CP-1/siRNAs in the presence or absence of reducing agents. (D) Improved siRNA stability in serum of CP-1/siRNAs compared to free siRNA and DSPE-siRNA conjugate as evaluated by electrophoresis (2% agarose gel). “M” stands for untreated siRNA marker [reprinted with permission from ref. 154. Copyright 2016, American Chemical Society].
Fig. 12
Fig. 12. (left) Schematic of CP-Carbo/GMP. (right) TGI in vivo. Carbo (dose, 10 mg kg−1) and GMP (4.6 mg kg−1) and CP-Carbo/GMP (doses, 10 mg kg−1 and 4.6 mg kg−1) were administered on days 0, 3, and 6 [reprinted with permission from ref. 155. Copyright 2016, American Chemical Society].
Fig. 13
Fig. 13. Scheme illustrating the one-pot synthesis of PEGylated nanoscale CPs and their use for tumor microenvironment (TME)-responsive anticancer therapy [reprinted with permission from ref. 156. Copyright 2018, Elsevier].
Fig. 14
Fig. 14. Multivariate MOFs with various linker ratios present a series of continuous energy states from which guest release kinetics can be dialed-in over a wide range [reprinted with permission from ref. 171. Copyright 2017, American Chemical Society].
Scheme 1
Scheme 1. Synthesis of ferrocenyl-derived heterometallic metallodendrimers [1][PF6]4–[8][PF6]8 [reprinted from ref. 191 with permission from The Royal Society of Chemistry].
Fig. 15
Fig. 15. Schematic representation of the synthetic procedures of the P@ZIF-8 nanocomposites as a DDS for the loading and multi-responsive release of DOX. HMeIM: 2-methylimidazolate [reprinted with permission from ref. 198. Copyright 2017, John Wiley and Sons].
Fig. 16
Fig. 16. Human transport protein carrier for the controlled photoactivation of an antitumor prodrug and real-time imaging of an intracellular tumor [reprinted with permission from ref. 210. Copyright 2015, American Chemical Society].
Fig. 17
Fig. 17. Attachment of trans-Pt(iv) to the mPEG114-b-PCL20-PLL10 copolymer and self-assembly of the polymer-trans Pt(iv) conjugate into micelles (M(Pt)). After UVA irradiation, Pt(iv) prodrugs are rapidly reduced to Pt(ii) and released [reprinted from ref. 214 with permission from The Royal Society of Chemistry].
Fig. 18
Fig. 18. Schematic representation of (a) the anticancer mechanism of photo-responsive Pt(iv)-azide complexes and (b) self-assembly and light-triggered dissociation of simultaneously photo-cleavable and activatable (SPCA) prodrug-backboned BCP micelle [reprinted with permission from ref. 215. Copyright 2016, John Wiley and Sons].
Fig. 19
Fig. 19. Encapsulation of RhB after the incubation with NCs after the UV-light irradiation and variations in the fluorescence intensity at 585 nm for three sequential encapsulation/release cycles [reprinted with permission from ref. 219. Copyright 2016, Springer Nature].
Fig. 20
Fig. 20. Preparation of PFcMA-containing NCs by sequential starved-feed emulsion polymerization and subsequent extraction (a) and loading malachite green as a model drug (d). Cryo-TEM images of PFcMA capsules (b) and oxidized PFcMA capsules (c) [reprinted with permission from ref. 223. Copyright 2016, John Wiley and Sons].
Fig. 21
Fig. 21. Release kinetics of RhB from Fc-containing amphiphilic BCP. The fluorescence intensity of the oxidized vesicles increases with time, indicating a redox release of RhB [reprinted from ref. 224 with permission from The Royal Society of Chemistry].
Fig. 22
Fig. 22. (a) In vitro loading and release chart of a drug from PACMO95-b-PAEFc25 micelles when triggered by oxidative stimuli. Cumulative release of PTX from PACMO95-b-PAEFC25 micelles triggered by various oxidizing agents (b) and different concentrations of H2O2 (c) [reprinted with permission from ref. 225. Copyright 2017, American Chemical Society].
Fig. 23
Fig. 23. Schematic cross-linking of PVFc-b-PEG micelles and its effect on the stabilization of encapsulated NR. (a) UV-vis measurement of the release of encapsulated NR. Black: uncross-linked micelles, decrease of absorbance due to uncontrolled NR release. Green: cross-linked micelles, no uncontrolled release: (I) no release through ultrasonication; (II) release after oxidation. (b) Scheme of the stage of crosslinking of inserted allyl groups in the corona of PVFc cores. The reaction scheme for the dissociation of a radical photoinitiator into an active benzoyl radical and an inactive acetal radical [reprinted with permission from ref. 226. Copyright 2016, American Chemical Society].
Fig. 24
Fig. 24. Synthesis of the porous multicompartment vesicles of ABC triblock terpolymer by seeded RAFT polymerization and the schematic on–off switch of the membrane pores of the multicompartment vesicles through oxidation/reduction [reprinted with permission from ref. 227. Copyright 2016, American Chemical Society].
Fig. 25
Fig. 25. Self-assembly formation of DDSs from Fc-DSP and selective release into cancer cells. (a) Schematic formation of the GUVs. (b) Fluorescence microscopy images of HeLa cells that were exposed to redox-active and non-redox-active GUVs. (c) Flow cytometry of HeLa and MRC-5 cells exposed to control (black), redox-active (red), and non-redox-active (green) active GUVs [reprinted with permission from ref. 228. Copyright 2016, American Chemical Society].
Fig. 26
Fig. 26. Schematic representation of a working protocol for a taste-masking drug based on physiological pH-responsive release of an unpleasant-tasting drug from MSNPs capped with the CP shell [reprinted from ref. 233 with permission from The Royal Society of Chemistry].
Fig. 27
Fig. 27. Illustration of a pH-responsive drug (DOX·HCl) release from G1c·WP6 with a loaded drug and corresponding profiles of in vitro cumulative drug release in an aqueous release medium at different pH values at 25 °C [reprinted with permission from ref. 236. Copyright 2016, American Chemical Society].
Fig. 28
Fig. 28. Magnetic stimuli-mediated precision therapeutics. Preparation of Fe(salen)-loaded polypyrrole (PPy)-PCL core–shell nanoassembled composites (iv) and core size modulation induced by biofunctionalization with bovine serum albumin (BSA) (vii) and gum arabic (GA) (viii). (i) PCL; (ii) PPy (benzosulfonate-doped); (iii) Fe(salen); (iv) Fe(salen)-loaded nanoassemblies; (v) BSA; (vi) GA; (vii) BSA-coated Fe(salen)-loaded nanoassemblies; (viii) GA-coated Fe(salen)-loaded nanoassemblies. Photos of the suspension are displayed at each stage of formulation [reprinted with permission from ref. 237. Copyright 2017, Springer Nature].
Fig. 29
Fig. 29. Translocation and drug release behavior of Bio-cage@Ru in nucleus. (a) Schematic illustration of the subcellular localization and release behavior of Bio-cage@Ru in HepG2 cells. (b) The fluorescence images of the trafficking of Bio-cage@Ru in HepG2 cells. The first line of images recorded the localization of free Bio-cage (20 μg mL−1), Bio-cage@Ru (5 μM) and free RuPOP (5 μM) in HepG2 cells at 8 h of incubation. The following images detailed the trafficking of Bio-cage@Ru in HepG2 cells for 8 h of incubation. The GFP images recorded the trafficking of Cy3-labeled Bio-cage from Bio-cage@Ru. The RFP images represented the fluorescence of RuPOP from Bio-cage@Ru. (c) The release rate of RuPOP from Bio-cage@Ru in PBS solution at pH 7.4, human plasma, PBS solution at pH 5.3 supplemented with 1 mg mL−1 lysozymes or DNase I respectively. Values were represented as means ± SD of triplicate. (d) The AFM images and the size changes of Bio-cage@Ru with or without the treatment of DNase I. Scale bar = 50 nm. The size and height of zone a and b were analyzed in histogram a and b respectively [reprinted with permission from ref. 238. Copyright 2016, Elsevier].
Fig. 30
Fig. 30. (A) Synthesis of DOX-loaded MOFs modified with ATP-responsive hydrogel. (B) In the presence of ATP, the decomposition of the modified hydrogel accelerates the release of DOX from MOFs. (C) Scanning electron microscopy (SEM) image of the MOFs. (D) SEM image of ATP-responsive hydrogel-modified MOFs [reprinted from ref. 239 with permission from The Royal Society of Chemistry].
Fig. 31
Fig. 31. Schematic diagram of drug loading and release for mechanized HMSs (a), and pH- (b) and oxidation-triggered (c) release profiles of encapsulated R6G [reprinted with permission from ref. 240. Copyright 2016, Elsevier].
Fig. 32
Fig. 32. Schematic formation of mPEG-β-CD/Fc-CPT supramolecular complex micelles (a) and their GSH/H2O2 responsive drug release in cancer cells (b). Release profiles of CPT from the mPEG-β-CD/Fc-CPT supramolecular complex micelles at different GSH concentrations (c) and H2O2 concentrations (d) [reprinted with permission from ref. 241. Copyright 2017, American Chemical Society].
Fig. 33
Fig. 33. Schematic formation of micelles and vesicles formed by supramolecular self-assembly of Fc-SS-b-CD/Fc-POEGMA. TEM images of micelles (a) and vesicles (c); in vitro release profiles of DOX from micelles (b) and vesicles (d) [reprinted with permission from ref. 242. Copyright 2016, American Chemical Society].
Fig. 34
Fig. 34. Illustration of the construction (a) of PEG/PNIPAM/CD-MNP micelles and a possible thermo- and redox-triggered mechanism for drug release (b). Cumulative release of DOX from micelles triggered by (c) temperature and (d) H2O2 [reprinted from ref. 243 with permission from The Royal Society of Chemistry].
Fig. 35
Fig. 35. Schematic illustration of the process of manufacturing and disassembling host–guest based colloidal MCs. (a) SEM image of colloidal MCs before template removal; (b) SEM image of one broken colloidal MC dried by CPD method; confocal laser scanning microscopy images of colloidal MCs at pH 2.0 for 0 (c) and 10 (d) min. Ad is amantadine hydrochloride [reprinted with permission from ref. 244. Copyright 2016, Elsevier].
Fig. 36
Fig. 36. Schematic dual-stimuli-responsive assembly and disassembly of mPEG-Fc/PNIPAM-β-CD micelles (a); TEM images before (b) and after oxidation (c) by H2O2; DOX-released profiles under single (d) or no stimulus and dual stimuli (e) [reprinted with permission from ref. 245. Copyright 2015, American Chemical Society].
Fig. 37
Fig. 37. Illustration of drug loading and thermo- or oxidation-responsive drug release from supramolecular polymer vesicles as a result of self-assembly of PNIPAM-P[6]·mPEG-Fc [reprinted from ref. 246 with permission from The Royal Society of Chemistry].
Fig. 38
Fig. 38. Illustration of the formation of supramolecular vesicles based on the host–guest complexation of FACP5 and the galactose derivative (G) and their redox/pH dual-responsive drug release. The inset shows the DOX release profiles from DOX-loaded FACP5G vesicles in water [reprinted from ref. 248 with permission from The Royal Society of Chemistry].
Fig. 39
Fig. 39. General strategies for combination drug therapy using polymer carriers. (A) The polymer conjugate of drug A can be combined either with the free drug B or with the polymer conjugate of B, on the same or different chains, where the “conjugate” refers to any form of the polymer drug that does not form NPs. (B) Drug A can be loaded into polymer NPs, which are then combined with free B or with B NPs, or both A and B can be co-assembled in the same NPs. (C) Drug A can be administered as a polymer conjugate, while drug B is administered in NPs [reprinted with permission from ref. 123. Copyright 2018, Elsevier].
Fig. 40
Fig. 40. The schematic illustration of the process of preparing Dex-SA, Dex-SA-DOX and Dex-SA-DOX-cisplatin [reprinted with permission from ref. 264. Copyright 2014, Elsevier].
Fig. 41
Fig. 41. (A) Schematic illustration of preparation of the c(RGDfK)-decorated dual-drug-loaded micelles. (B) The micelles enter tumor cells by receptor-mediated endocytosis, and the loaded two drugs act synergistically intracellularly [reprinted with permission from ref. 269. Copyright 2014, John Wiley and Sons].
Fig. 42
Fig. 42. (a) Synthesis of a multifunctional single-drug Z-DMC-CIS(N3), (b) conjugation of a single-drug with a biodegradable amphiphilic BCP to obtain a polymer–(multifunctional single-drug) conjugate micelles, and (c) possible paths after the polymer–drug conjugate micelles enter the cisplatin-resistant cancer cells [reprinted from ref. 270 with permission from The Royal Society of Chemistry].
Fig. 43
Fig. 43. (a) Synthesis of canthaplatin, (b) preparation of polymer/canthaplatin micelles, and (c) schematic representation of the intracellular action after endocytosis of polymer/canthaplatin micelles [reprinted from ref. 272 with permission from The Royal Society of Chemistry].
Fig. 44
Fig. 44. Schematic illustration of DDBSP for synergistic eradication of PDLC. (A) Illustration of the structure of Pt(iv)-1, the polymerization of DDBSP, self-assembly and chain-shattering of DD-NP with the release of active Pt(ii) and DMC, as well as key features of DDBSP and DD-NP. (B) Illustration of the creation of a PDLC model and Pt-based DMCT after intravenous injection of DD-NP. (C) Possible dual anticancer mechanisms after endocytosis of DD-NP by cancer cells [reprinted with permission from ref. 230. Copyright 2018, John Wiley and Sons].
Fig. 45
Fig. 45. Schematic assembly and multimodal controlled release modalities of MSNPs 1 (a); sequential (b) and concurrent (c) release profiles of encapsulated GEM and DOX [reprinted with permission from ref. 274. Copyright 2015, American Chemical Society].
Fig. 46
Fig. 46. (A) Schematic illustrations of molecular and supramolecular engineering of theranostic supramolecular PEGylated dendritic systems. (B) Dynamic Light Scattering (DLS) results (in aqueous solutions) and TEM images for theranostic supramolecular PEGylated dendritic systems (TSPDSs) [reprinted with permission from ref. 279. Copyright 2016, Ivyspring International Publisher].
Fig. 47
Fig. 47. (A) The process of manufacturing a porphyrin-based MOFs nanoplatform (TPZ@PCN@Mem). (B) Schematic diagram of TPZ@PCN@Mem for synergistic therapy of porphyrin-mediated PDT and hypoxia-induced chemotherapy [reprinted with permission from ref. 286. Copyright 2017, Elsevier].
Fig. 48
Fig. 48. Schematic representation of AuNR@MOFs loaded CPT for synergistic cancer therapy of chemotherapy/PDT/PTT [reprinted with permission from ref. 291. Copyright 2018, John Wiley and Sons].
Fig. 49
Fig. 49. (A) The preparation process of TBP-MOF. (B) Schematic presentation of TBP-MOFs-induced photodynamic cancer immunotherapy for effective inhibition of cancer metastasis [reprinted with permission from ref. 293. Copyright 2018, American Chemical Society].
Fig. 50
Fig. 50. (A) Processes for the preparation of PCN-224 as a nanocarrier for the delivery of GOx and catalase. (B) In vivo immune escape and homotypic cancer targeting of the composites. (C) Multifunctional MOFs-based nanoplatform for synergistic PDT and starvation therapy [reprinted with permission from ref. 294. Copyright 2018, American Chemical Society].
None
Gulzhian I. Dzhardimalieva
None
Lev N. Rabinskiy
None
Kamila A. Kydralieva
None
Igor E. Uflyand

Similar articles

Cited by

References

    1. Martyn J.-A. Paliadelis P. Perry C. Nurse Educ. Pract. 2019;37:109–114. doi: 10.1016/j.nepr.2019.05.006. - DOI - PubMed
    1. Dhruva S. S. Ross J. S. Desai N. R. Pharmacy and Therapeutics (P&T) 2018;43:464–472. - PMC - PubMed
    1. Kim Y.-C. Min K. A. Jang D.-J. Ahn T. Y. Min J. H. Yu B. E. Cho K. H. J. Pharm. Invest. doi: 10.1007/s40005-019-00452-0. - DOI
    1. Vadlapudi A. D., Kwatra D. and Mitra A. K., in Drug Delivery, ed. A. K. Mitra, D. Kwatra and A. D. Vadlapudi, Jones & Bartlett Learning, Burlington, USA, 2015, pp. 1–7
    1. Duarte Y. Márquez-Miranda V. Miossec M. J. González-Nilo F. Wiley Interdiscip. Rev.: Nanomed. Nanobiotechnol. 2019;11:e1554. - PubMed