

Serum metabolomics strategy for understanding the therapeutic effects of Yin-Chen-Hao-Tang against Yanghuang syndrome
- PMID: 35539139
- PMCID: PMC9078382
- DOI: 10.1039/c7ra11048k
Serum metabolomics strategy for understanding the therapeutic effects of Yin-Chen-Hao-Tang against Yanghuang syndrome
Abstract
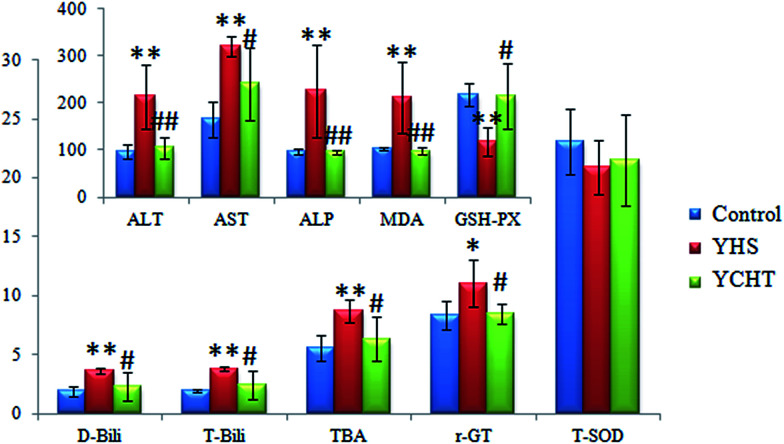
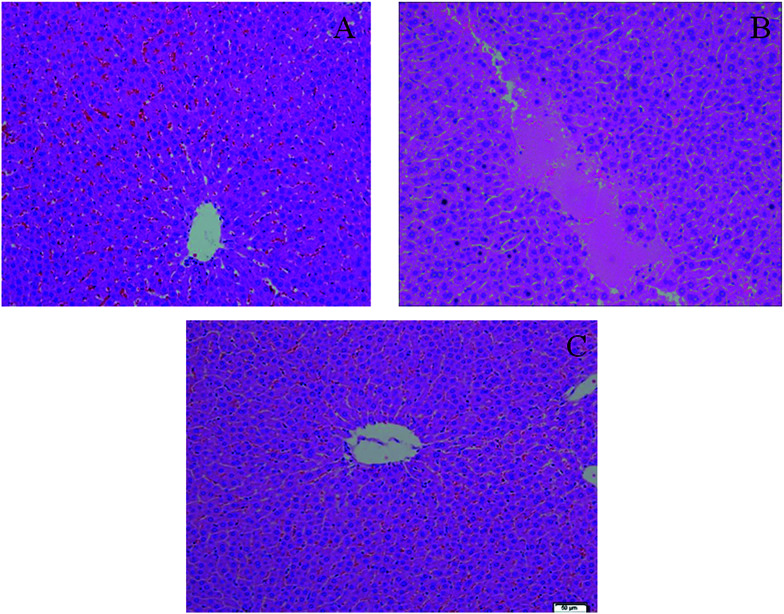
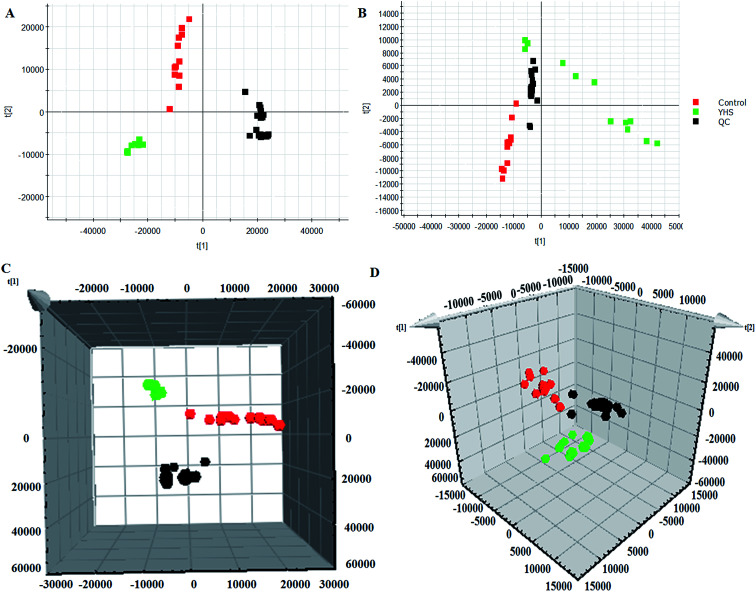
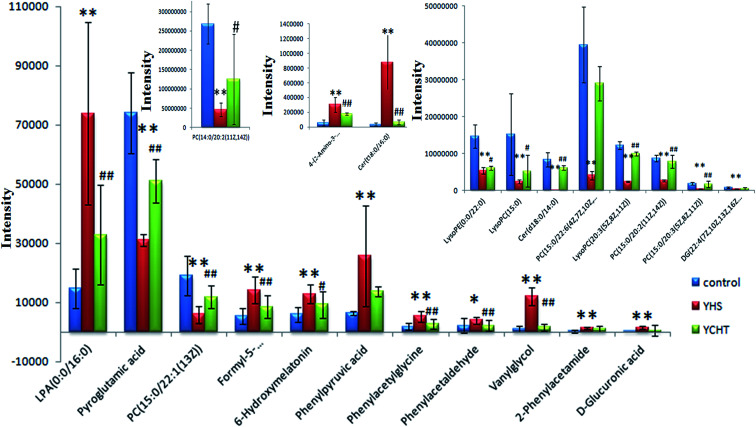
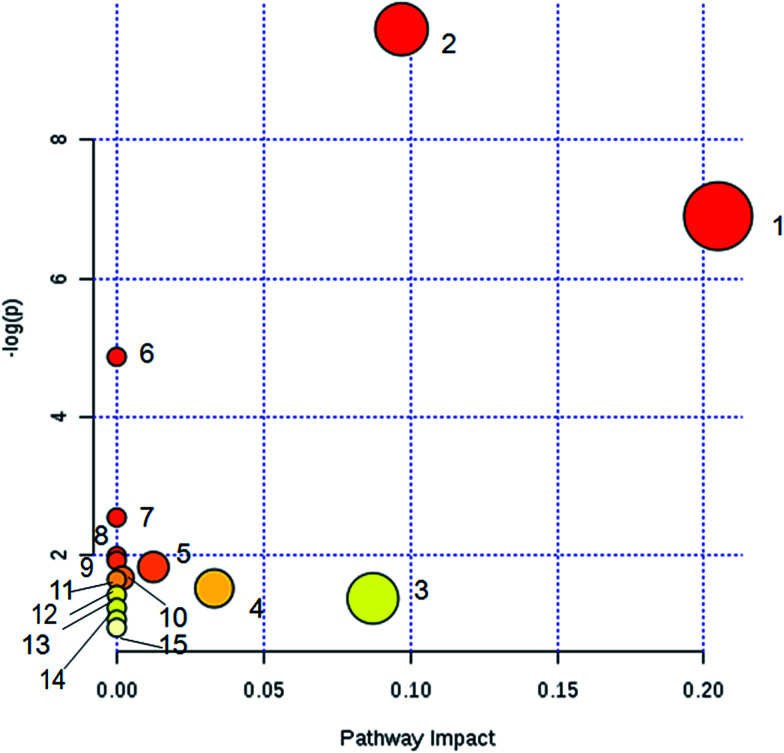
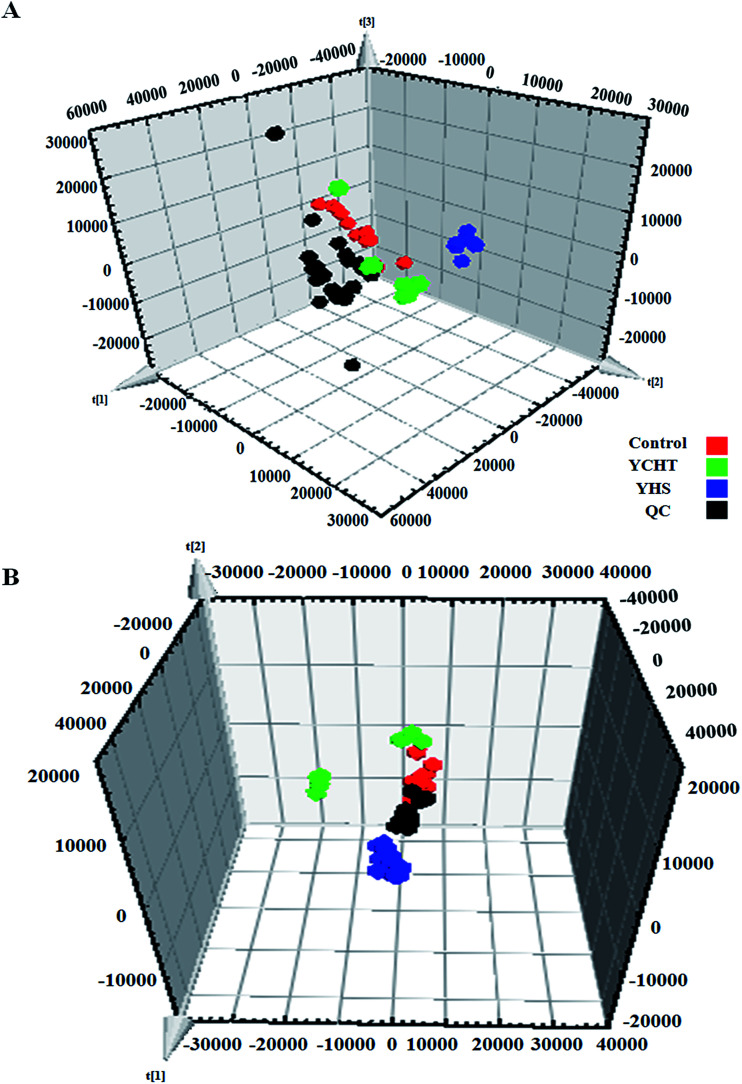
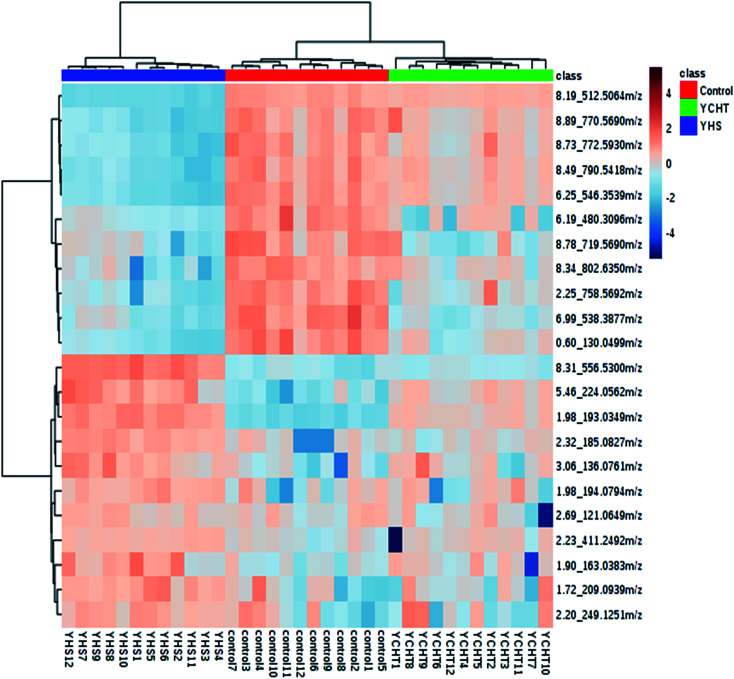
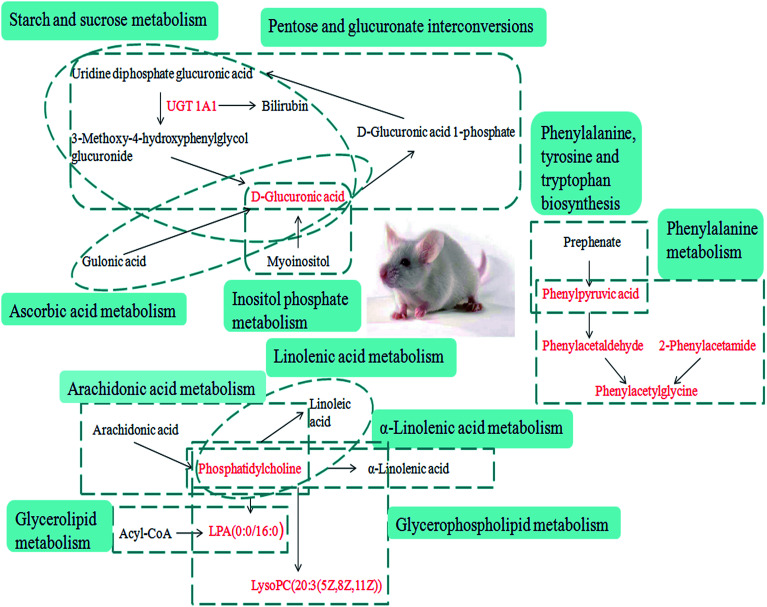
Yin-Chen-Hao-Tang (YCHT), a classic Chinese herbal formula, is characterized by its strong therapeutic effects of liver regulation and relief of jaundice, especially Yanghuang syndrome (YHS). YHS is a type of jaundice with damp-heat pathogenesis, and it is considered a complicated Chinese medicine syndrome (CMS). The accurate mechanism for healing YHS has not yet been completely reported. The purpose of the current research is to investigate the expression of endogenous biomarkers in YHS mice and evaluate the clinical therapeutic effect of YCHT. Serum samples were analyzed using UPLC-Q/TOF-MS techniques in order to determine differential metabolites to elucidate the functional mechanism of YCHT on YHS through metabolite profiling combined with multivariate analysis. Simultaneously, the exact diversification of YHS mice was elucidated using blood biochemistry indexes and histopathological examination, and the results indicated that YHS is markedly improved by YCHT. Unsupervised principal component analysis (PCA) patterns were constructed to dissect the variances of metabolic profiling. Overall, 22 potential biomarkers were identified using a metabolomics approach based on an accurate MS/MS approach, clustering and distinguishing analysis. The present work demonstrates that the effectiveness of YCHT against YHS prompts distinct discrepancies in metabolic profiles by adjusting biomarkers and regulating metabolic disorders. A total of 15 metabolic pathways were involved in biological disturbance. This demonstrates that metabolomic techniques are powerful means to explore the pathogenesis of CMS and the therapeutic effects of traditional Chinese formulae.
This journal is © The Royal Society of Chemistry.
Conflict of interest statement
The authors declare no competing financial interests.
Figures
Similar articles
-
UPLC-G2Si-HDMS untargeted metabolomics for identification of metabolic targets of Yin-Chen-Hao-Tang used as a therapeutic agent of dampness-heat jaundice syndrome.J Chromatogr B Analyt Technol Biomed Life Sci. 2018 Apr 1;1081-1082:41-50. doi: 10.1016/j.jchromb.2018.02.035. Epub 2018 Feb 27. J Chromatogr B Analyt Technol Biomed Life Sci. 2018. PMID: 29502028
-
Determining the protective effects of Yin-Chen-Hao Tang against acute liver injury induced by carbon tetrachloride using 16S rRNA gene sequencing and LC/MS-based metabolomics.J Pharm Biomed Anal. 2019 Sep 10;174:567-577. doi: 10.1016/j.jpba.2019.06.028. Epub 2019 Jun 21. J Pharm Biomed Anal. 2019. PMID: 31261038
-
Functional metabolomics discover pentose and glucuronate interconversion pathways as promising targets for Yang Huang syndrome treatment with Yinchenhao Tang.RSC Adv. 2018 Oct 31;8(64):36831-36839. doi: 10.1039/c8ra06553e. eCollection 2018 Oct 26. RSC Adv. 2018. PMID: 35558940 Free PMC article.
-
Recent Studies and Progression of Yin Chen Hao ( Yīn Chén Hāo), a Long-term Used Traditional Chinese Medicine.J Tradit Complement Med. 2013 Jan;3(1):2-6. doi: 10.4103/2225-4110.106533. J Tradit Complement Med. 2013. PMID: 24716150 Free PMC article. Review.
-
Therapeutic mechanism of Yīn-Chén-Hāo decoction in hepatic diseases.World J Gastroenterol. 2017 Feb 21;23(7):1125-1138. doi: 10.3748/wjg.v23.i7.1125. World J Gastroenterol. 2017. PMID: 28275293 Free PMC article. Review.
Cited by
-
Metabolomics Analysis Coupled With UPLC/MS on Therapeutic Effect of Jigucao Capsule Against Dampness-Heat Jaundice Syndrome.Front Pharmacol. 2022 Jan 28;13:822193. doi: 10.3389/fphar.2022.822193. eCollection 2022. Front Pharmacol. 2022. PMID: 35153793 Free PMC article.
-
Metabolomics biotechnology, applications, and future trends: a systematic review.RSC Adv. 2019 Nov 14;9(64):37245-37257. doi: 10.1039/c9ra06697g. eCollection 2019 Nov 13. RSC Adv. 2019. PMID: 35542267 Free PMC article. Review.
-
An integrated metabolomics and 16S rRNA gene sequencing approach exploring the molecular pathways and potential targets behind the effects of Radix Scrophulariae.RSC Adv. 2019 Oct 17;9(57):33354-33367. doi: 10.1039/c9ra03912k. eCollection 2019 Oct 15. RSC Adv. 2019. PMID: 35529111 Free PMC article.
-
High-throughput untargeted metabolomics and chemometrics reveals pharmacological action and molecular mechanism of chuanxiong by ultra performance liquid chromatography combined with quadrupole-time-of-flight-mass spectrometry.RSC Adv. 2019 Nov 28;9(67):39025-39036. doi: 10.1039/c9ra06267j. eCollection 2019 Nov 27. RSC Adv. 2019. PMID: 35540684 Free PMC article.
-
Functional metabolomics using UPLC-Q/TOF-MS combined with ingenuity pathway analysis as a promising strategy for evaluating the efficacy and discovering amino acid metabolism as a potential therapeutic mechanism-related target for geniposide against alcoholic liver disease.RSC Adv. 2020 Jan 15;10(5):2677-2690. doi: 10.1039/c9ra09305b. eCollection 2020 Jan 14. RSC Adv. 2020. PMID: 35496090 Free PMC article.
References
-
- Chu H. Zhang A. Han Y. et al., Metabolomics approach to explore the effects of Kai-Xin-San on Alzheimer’s disease using UPLC/ESI-Q-TOF mass spectrometry. J. Chromatogr. B: Anal. Technol. Biomed. Life Sci. 2016;50:1015–1016. - PubMed
-
- Zhang A. Sun H. Wang X. Mass spectrometry-driven drug discovery for development of herbal medicine. Mass Spectrom. Rev. 2016;9999:1–14. - PubMed
LinkOut - more resources
Full Text Sources