

Effect of Rhizoma Paridis saponin on the pain behavior in a mouse model of cancer pain
- PMID: 35539228
- PMCID: PMC9080318
- DOI: 10.1039/c8ra00797g
Effect of Rhizoma Paridis saponin on the pain behavior in a mouse model of cancer pain
Abstract
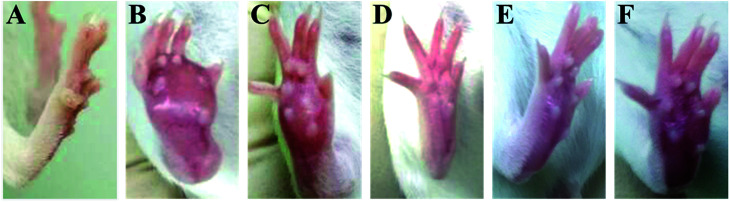
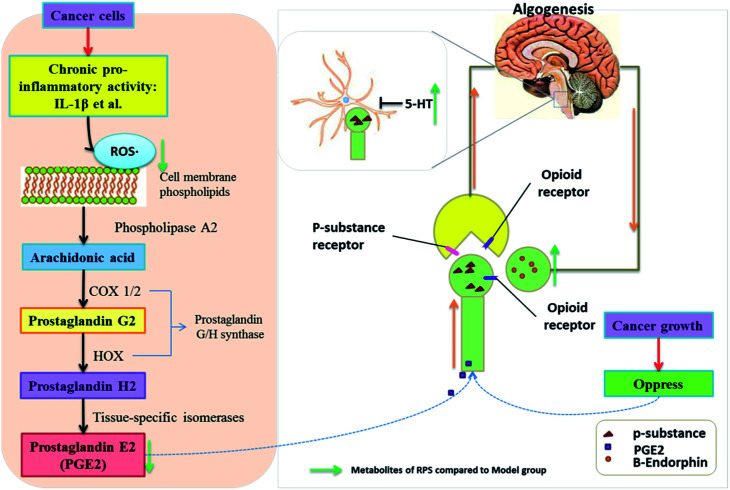
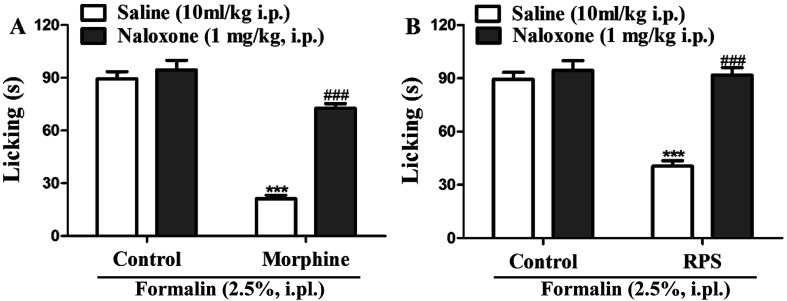
Rhizoma Paridis saponins (RPS) as active parts of P. polyphylla Smith var. yunnanensis has been used as an anti-cancer drug in traditional Chinese medicine. In this study, RPS was first found to demonstrate a potent effect on markedly reducing the pain induced by cancer. Therefore, the aim of this study was to further explore the analgesic effect of RPS and its possible reaction pathway on H22 hepatocarcinoma cells inoculated in the hind right paw of mice. Cancer-induced pain model mice were randomly divided into 5 groups (n = 10) and orally administered with RPS (50-200 mg kg-1) for 2 weeks. On the last day of treatment, the pain behavior of mice was measured using hot-plate test and open field test, and brain tissues were sampled for detection of biochemical indices, malondialdehyde (MDA), superoxide dismutase (SOD), prostaglandin E2 (PGE2), serotonin (5-HT) and β-endorphin (β-EP). Moreover, the concentrations of NF-κB and IL-1β in the blood serum were measured by ELISA reagent kits. In addition, naloxone, the non-selective antagonist of opioid receptors, was used to identify the opioid receptors involved in RPS's action. It has been found that RPS alleviates cancer pain mainly via the suppression of inflammatory pain induced by oxidative damage, such as decreasing MDA and PGE2 levels, renewing activity of SOD, as well as increasing 5-HT and β-EP in the brain and suppressing the expression of NF-κB and IL-1β in the serum in a concentration-dependent manner. Overall, the current study highlights that RPS has widespread potential antinociceptive effects on a mouse model of chronic cancer pain, which may be associated with the peripheral nervous system and the central nervous system.
This journal is © The Royal Society of Chemistry.
Conflict of interest statement
We have no conflict of interest in this research.
Figures


Similar articles
-
A new insight into material basis of rhizoma Paridis saponins in alleviating pain.J Ethnopharmacol. 2024 Apr 6;323:117642. doi: 10.1016/j.jep.2023.117642. Epub 2023 Dec 25. J Ethnopharmacol. 2024. PMID: 38151180
-
Anti-fibrosis and anti-cirrhosis effects of Rhizoma paridis saponins on diethylnitrosamine induced rats.J Ethnopharmacol. 2014;151(1):407-12. doi: 10.1016/j.jep.2013.10.051. Epub 2013 Nov 7. J Ethnopharmacol. 2014. PMID: 24212073
-
Inhibition of diethylnitrosamine-induced liver cancer in rats by Rhizoma paridis saponin.Environ Toxicol Pharmacol. 2016 Sep;46:103-109. doi: 10.1016/j.etap.2016.07.004. Epub 2016 Jul 14. Environ Toxicol Pharmacol. 2016. PMID: 27451357
-
The role of Rhizoma Paridis saponins on anti-cancer: The potential mechanism and molecular targets.Heliyon. 2024 Sep 2;10(17):e37323. doi: 10.1016/j.heliyon.2024.e37323. eCollection 2024 Sep 15. Heliyon. 2024. PMID: 39296108 Free PMC article. Review.
-
Untiring Researches for Alternative Resources of Rhizoma Paridis.Nat Prod Bioprospect. 2018 Aug;8(4):265-278. doi: 10.1007/s13659-018-0179-5. Epub 2018 Jul 4. Nat Prod Bioprospect. 2018. PMID: 29974350 Free PMC article. Review.
Cited by
-
Therapeutic effects on cancer of the active ingredients in rhizoma paridis.Front Pharmacol. 2023 Feb 21;14:1095786. doi: 10.3389/fphar.2023.1095786. eCollection 2023. Front Pharmacol. 2023. PMID: 36895945 Free PMC article. Review.
-
Polyphyllin VI screened from Chonglou by cell membrane immobilized chromatography relieves inflammatory pain by inhibiting inflammation and normalizing the expression of P2X3 purinoceptor.Front Pharmacol. 2023 Feb 14;14:1117762. doi: 10.3389/fphar.2023.1117762. eCollection 2023. Front Pharmacol. 2023. PMID: 36865911 Free PMC article.
-
Advancements and challenges in pharmacokinetic and pharmacodynamic research on the traditional Chinese medicine saponins: a comprehensive review.Front Pharmacol. 2024 May 7;15:1393409. doi: 10.3389/fphar.2024.1393409. eCollection 2024. Front Pharmacol. 2024. PMID: 38774213 Free PMC article. Review.
-
Diversity of endophytic bacteria in Paris Polyphylla var. yunnanensis and their correlation with polyphyllin content.BMC Microbiol. 2025 Feb 26;25(1):93. doi: 10.1186/s12866-025-03814-x. BMC Microbiol. 2025. PMID: 40011854 Free PMC article.
References
LinkOut - more resources
Full Text Sources