. 2018 May 11;8(31):17435-17442.
doi: 10.1039/c8ra02561d. eCollection 2018 May 9.

Structural disorder in the high-temperature cubic phase of GeTe

Affiliations

Structural disorder in the high-temperature cubic phase of GeTe

Ming Xu et al. RSC Adv. .

Abstract

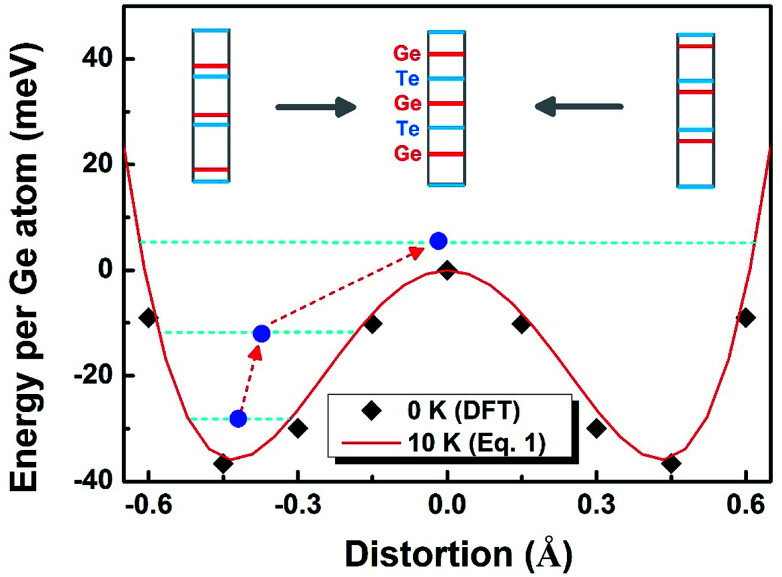
In traditional materials science, structural disorder tends to break the symmetry of the lattice. In this work, however, we studied a case which may be opposite to this intuition. The prototypical phase change material, GeTe, undergoes the phase transition from the rhombohedral structure to a more symmetric cubic one at ∼625 K. Using ab initio molecular dynamics simulations, we demonstrated that even in the cubic phase, the lattice is constructed by random short and long bonds, instead of bonds with a uniform length. Such bifurcation of the bond lengths enabled by Peierls-like distortion persists in the entire temperature range (0-900 K), yet with different degrees of disorder, e.g., the atoms are distorted along a certain direction in the rhombohedral phase (i.e., structural order) but the distortion varies stochastically in terms of direction and amplitude at high T (i.e., structural disorder). A more symmetric lattice frame coexisting with severe local structural disorder is the signature of this cubic GeTe. Our simulations have provided a theoretical support on the disordered Peierls-like distortion in the high-T cubic phase discovered earlier by X-ray experiments. By modulating the physical properties that different degrees of disorder may induce, we are able to design better functional materials for various applications in electronic and photonic devices.


Conflict of interest statement

There are no conflicts to declare.

Figures

Fig. 1
Fig. 1. Bond lengths of GeTe calculated from AIMD models (solid lines) show that the PLD leads to the short and long bonds at the RT (see the ball–stick model on the right). Interestingly, the short and long bonds (colored by blue and red) persist even beyond the rhombohedral to cubic transition at ∼625 K, consistent with the EXAFS observation (open circles), but different from an earlier neutron diffraction experiment which found the short and long bonds converge upon phase transformation (dashed lines).
Fig. 2
Fig. 2. The distributions of near-collinear bond lengths calculated from AIMD models at different temperatures. At low T, the atoms vibrate in a small area, and thus the short and long bonds are well defined. At much higher T, however, atoms span in much larger areas and the distributions of short and long bonds become more flattened. A proposed atomic distribution before and after the phase transition is plotted schematically (not in scale) based on the bond distribution. The red and blue dots denote for the instantaneous positions of Ge and Te atoms, and the dashed lines are the average positions of the atomic layers.
Fig. 3
Fig. 3. (a) Distribution of the distances between all the atomic trajectories (dark dots in the inset) and their central positions (red open circle in the inset). Atoms are mobile in larger areas at higher T. (b) Average distance between the trajectories and central positions.
Fig. 4
Fig. 4. (a) The collective alignments of crystalline GeTe at 300 K and 800 K both shaped into distorted octahedrons, with the cluster at higher T having more diffused vertex. The isovalue of the atomic density is set to be 0.15 Å−3. (b) The structure fitting scores, characterizing the difference between all the local clusters, also demonstrate that GeTe at higher T is more disordered locally.
Fig. 5
Fig. 5. The two-well energy profile calculated by the NEB method and fitted by the distortion model. The r-GeTe is trapped inside one energy basin (known as PLD) until the high T enables the system to jump out of the energy “pitfall”, leading to the phase transformation into a more symmetric c-GeTe. The blue solid dots denote the average distortions between Ge and Te layers.
Fig. 6
Fig. 6. DFT-determined band gaps for instantaneous structures of crystalline GeTe at different MD temperatures, representing for different degrees of structural disorder. The GGA-1/4 correction was applied to the electronic structure calculations. The band gaps of completely ordered r-GeTe and c-GeTe were also calculated for comparison.

References

    1. Cairns A. B. Goodwin A. L. Chem. Soc. Rev. 2013;42:4881–4893. doi: 10.1039/C3CS35524A. - DOI - PubMed
    1. Siegrist T. Jost P. Volker H. Woda M. Merkelbach P. Schlockermann C. Wuttig M. Nat. Mater. 2011;10:202–208. doi: 10.1038/nmat2934. - DOI - PubMed
    1. Zhang W. Thiess A. Zalden P. Zeller R. Dederichs P. H. Raty J. Y. Wuttig M. Blugel S. Mazzarello R. Nat. Mater. 2012;11:952–956. doi: 10.1038/nmat3456. - DOI - PubMed
    1. Xu M. Zhang W. Mazzarello R. Wuttig M. Adv. Sci. 2015;2:1500117. doi: 10.1002/advs.201500117. - DOI - PMC - PubMed
    1. Jost P. Volker H. Poitz A. Poltorak C. Zalden P. Schäfer T. Lange F. R. L. Schmidt R. M. Holländer B. Wirtssohn M. R. Wuttig M. Adv. Funct. Mater. 2015;25:6399–6406. doi: 10.1002/adfm.201500848. - DOI