Review
. 2018 May 14;8(31):17535-17550.
doi: 10.1039/c8ra02658k. eCollection 2018 May 9.

1,3,5-Triphenylbenzene: a versatile photoluminescent chemo-sensor platform and supramolecular building block

Affiliations
Review

1,3,5-Triphenylbenzene: a versatile photoluminescent chemo-sensor platform and supramolecular building block

Pratap Vishnoi et al. RSC Adv. .

Abstract

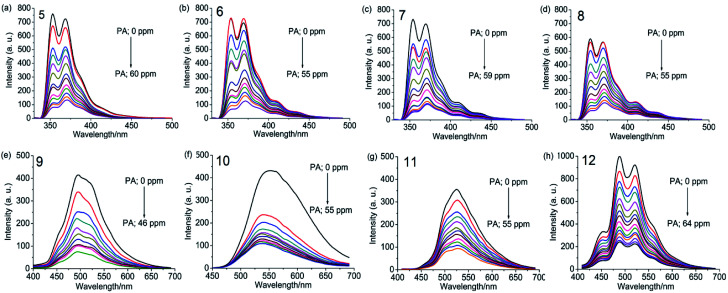
Fluorescence chemo-sensors for species of environmental and biological significance have emerged as a major research area in recent years. In this account, we describe fluorescence quenching as well as enhancement-based chemo-sensors obtained by employing C 3-symmetric 1,3,5-triphenylbenzene (1,3,5-TPB) as the fluorescence signalling unit. 1,3,5-TPB is a thermally and photochemically stable fluorescent platform with π-electron-rich characteristics. Starting from this platform, supramolecular, discrete, triphenylbenzene-carbazole, covalent-organic framework, covalent-organic polymer and conjugated polymer based sensors have been developed for the selective detection of polynitroaromatic compounds, trinitrotoluene (TNT), dinitrotoluene (DNT) and picric acid (PA). Tris-salicylaldimine Schiff bases have been synthesized for the selective sensing of fluoride ions through a fluorescence turn-on mechanism. It is likely that it should be possible to develop other highly selective and sensitive chemo-sensors by incorporating 1,3,5-TPB as the fluorophore unit.


Conflict of interest statement

The authors declare that there is no conflict of interests regarding the publication of this paper.

Figures

Fig. 1
Fig. 1. Molecular orbital schematic presentation of PET between (a) fluorophore (D) and quencher (A), and (b) fluorophore and receptor.
Fig. 2
Fig. 2. Supramolecular structure of 1, (a) depiction of intermolecular N–H⋯N hydrogen bonds (red dotted bonds) and (b) crystal structure (inset shows a cluster of six –NH2 groups, connected by hydrogen bonds). Reproduced from ref. 40 with permission. Copyright© 2014, American Chemical Society.
Fig. 3
Fig. 3. (a) UV-Vis absorption spectrum (1.6 × 10⁻⁶ M, ε1 = 6.18 × 10⁴ M−1 cm−1, ε2 = 6.59 × 10⁴ M−1 cm−1) and photoluminescence spectrum (1.0 × 10⁻⁶ M, λex = 290 nm) of 1 in acetonitrile, (b) photoluminescence spectra of 1 with TNT (640 equivalents), PA (32 equivalents), m-DNB (720 equivalents), DNT (480 equivalents) and p-DNB (450 equivalents), (c) Stern–Volmer plots, (d) relative PL quenching on the addition of 32.0 equivalents of each PNAC and other electron-deficient analytes, and (e and f) time-resolved photoluminescence spectra before and after the additions of multiple concentrations of PA and TNT, respectively (λex = 295 nm). Reproduced from ref. 39 with permission. Copyright© 2014, Royal Society of Chemistry.
Fig. 4
Fig. 4. (a) Photographs of co-crystals of 1–PA, (b) showing hydrogen bonds in 1–PA, (c) showing hydrogen bonds in 1–TNT, (d) showing alternate layers in 1–m-DNB, connected by N–H⋯O hydrogen bonds, and (e) space-filling model of co-crystals of 1–m-DNB in which the atoms are shown by spheres of van der Waals radii. Reproduced from ref. 40 with permission. Copyright© 2014, American Chemical Society.
Scheme 1
Scheme 1. (a) Synthesis of 2 and 3 from 1. (b) Molecular structure of 2, drawn using CIF obtained from ref. 42. Copyright© 2017, Springer Nature. (c) Molecular structure of 3 drawn using CIF obtained from ref. 8. Copyright© 2015, Royal Society of Chemistry and the Centre National de la Recherche Scientifique.
Fig. 5
Fig. 5. (a) UV-visible absorption spectra of 1, 2 and 3 (λmax for the n–π* transition = 289, 300 and 309 nm), and (b) photoluminescence spectra of 1, 2 and 3 (λem = 405, 415 and 425 nm) in acetonitrile (see Scheme 1 for the structures of 1–3).
Fig. 6
Fig. 6. Photoluminescence spectra of (a) 2 (1.0 × 10⁻⁶ M in acetonitrile, excitation wavelength = 300 nm) with PA (0.0 to 20.0 equivalents). Reproduced from ref. 42 with permission. Copyright© 2017, Springer Nature. (b) 3 (1.0 × 10⁻⁶ M in acetonitrile, excitation wavelength = 310 nm) with PA (0.0 to 8.0 equivalents). Reproduced from ref. 8 with permission. Copyright© 2015, Royal Society of Chemistry and the Centre National de la Recherche Scientifique.
Scheme 2
Scheme 2. (a) Preparation of the 3–PA complex in a 1 : 3 stoichiometry. (b) Crystal structure of 3–PA; hydrogen bonds are indicated by green dotted bonds. Reproduced from ref. 8 with permission. Copyright© 2015, Royal Society of Chemistry and the Centre National de la Recherche Scientifique.
Scheme 3
Scheme 3. Synthesis of 4.
Scheme 4
Scheme 4. Synthesis of monomers 5–8 and polymers carbazoles 9–12. Reproduced from ref. 43 with permission. Copyright© 2016, Wiley-VCH Verlag GmbH & Co. KGaA, Weinheim.
Fig. 7
Fig. 7. Photoluminescence spectra of 5–8 in dichloromethane (1.0 × 10⁻⁶ M, λex = 295 nm) and 9–12 in acetonitrile (0.2 mg mL−1, λex = 300 nm), with progressive additions of PA. Reproduced from ref. 43 with permission. Copyright© 2016, Wiley-VCH Verlag GmbH & Co. KGaA, Weinheim.
Fig. 8
Fig. 8. Various covalent-organic frameworks with imine linkages.
Fig. 9
Fig. 9. Plausible structures of COFs 19–22. Different colours (blue and red) represent different building blocks.
Fig. 10
Fig. 10. Gas absorption isotherms of 19–22. (a) N2 adsorption isotherms at 77 K, (b) H2 adsorption isotherms at 77 K and (c) CO2 adsorption isotherms at 273 K and 1 bar. Reproduced from ref. 31 with permission. Copyright© 2015, Royal Society of Chemistry.
Fig. 11
Fig. 11. Photoluminescence spectra of acetonitrile dispersions (0.2 mg mL−1) of (a) 19 (λex = 285 nm), (b) 20 (λex = 300 nm), (c) 21 (λex = 285 nm) and (d) 22 (λex = 290 nm), showing progressive quenching of photoluminescence on the addition of PA, and (e) the degree of PL quenching of COFs (%) with 13.0 ppm of PA, DNT, m-DNB and p-DNB. Reproduced from ref. 31 with permission. Copyright© 2015, Royal Society of Chemistry.
Fig. 12
Fig. 12. (a) Structure of 23 and (b) photoluminescence spectra of an acetonitrile suspension of 23 (0.2 mg mL−1; λex = 300 nm) in the presence of PA (0.0 to 13.0 ppm). Reproduced from ref. 56 with permission. Copyright© 2018, Springer Nature.
Fig. 13
Fig. 13. (a) Structure of 24, (b) quenching of PL of a film grown for 72 h on exposure to RDX solution prepared in a mixture of CH3CN : MeOH (1 : 1 v/v), (c) relative PL quenching (%) of films on exposure to RDX in solution with different reaction time, and (d) PL quenching (%) of films on exposure to RDX vapour at different times. Reproduced from ref. 58 with permission. Copyright© 2013, American Chemical Society.
Scheme 5
Scheme 5. Synthesis of 25–27.
Fig. 14
Fig. 14. (a) Chromogenic response of 25–27 (10.0 × 10⁻³ M in dry tetrahydrofuran) in the presence of 20 equivalents of various anions, (b) PL spectra of 25 with TBAF (0 to 40 equivalents), (c) PL spectra of 26 with TBAF (0 to 200 equivalents) and (d) PL spectra of 27 with TBAF (0 to 10 equivalents). The insets in b–d show emission intensity versus concentration of TBAF. Reproduced from ref. 63 with permission. Copyright© 2016, Springer Nature.
Fig. 15
Fig. 15. Schematic of the intramolecular photo-induced electron transfer (PET) mechanism of photoluminescence “off-on” for tris-salicylaldimine Schiff bases in the absence and presence of fluoride ions. Sal-1, Sal-2 and Sal-3 indicate the receptors formed by salicylaldehyde, 3,5-dimethyl-2-hydroxy benzaldehyde and 5-bromo-2-hydroxy-3-tert-butylbenzaldehyde, respectively. Reproduced from ref. 63 with permission. Copyright© 2016, Springer Nature.
Fig. 16
Fig. 16. (a) C3-symmetric tris-boronic acids, (b) proposed complex of α-hydroxycarboxylic acid with the sensor molecule, (c) PL spectra of 28a (1.4 × 10⁻² mM, λex = 297 nm) and (d) 28b (6 × 10⁻² mM, λex = 257 nm) in the presence of 5.0 mM of different analytes (a) free, (b) d-glucose, (c) d-galactose, (d) galacturonic acid, (e): lactic acid, (f): malic acid, (g): tartaric acid. Reproduced from ref. 68 with permission. Copyright© 2008, Elsevier Ltd.
Fig. 17
Fig. 17. (a) Structures of 29–31 and (b) photoluminescence spectra of 31 (1.0 × 10⁻³ M) in the presence of various metal ions (10.0 × 10⁻³ M). Cu(ii) selectively quenches the photoluminescence. Reproduced from ref. 24 with permission. Copyright© 2011, Royal Society of Chemistry.
None
Pratap Vishnoi
None
Dhananjayan Kaleeswaran
None
Ramaswamy Murugavel

Similar articles

Cited by

References

    1. Kolanowski J. L. Liu F. New E. J. Chem. Soc. Rev. 2018;47:195–208. doi: 10.1039/C7CS00528H. - DOI - PubMed
    1. Wu D. Sedgwick A. C. Gunnlaugsson T. Akkaya E. U. Yoon J. James T. D. Chem. Soc. Rev. 2017;46:7105–7123. doi: 10.1039/C7CS00240H. - DOI - PubMed
    1. Sun X. Wang Y. Lei Y. Chem. Soc. Rev. 2015;44:8019–8061. doi: 10.1039/C5CS00496A. - DOI - PubMed
    1. Thomas S. W. Joly G. D. Swager T. M. Chem. Rev. 2007;107:1339–1386. doi: 10.1021/cr0501339. - DOI - PubMed
    1. Ma X. Tao F. Zhang Y. Li T. Raymo F. M. Cui Y. J. Mater. Chem. A. 2017;5:14343–14354.