

Differential CRABP-II and FABP5 expression patterns and implications for medulloblastoma retinoic acid sensitivity
- PMID: 35539303
- PMCID: PMC9079906
- DOI: 10.1039/c8ra00744f
Differential CRABP-II and FABP5 expression patterns and implications for medulloblastoma retinoic acid sensitivity
Abstract
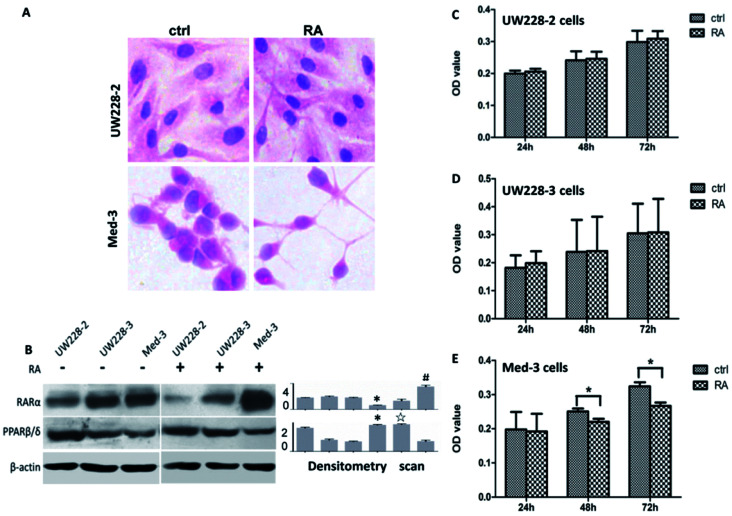
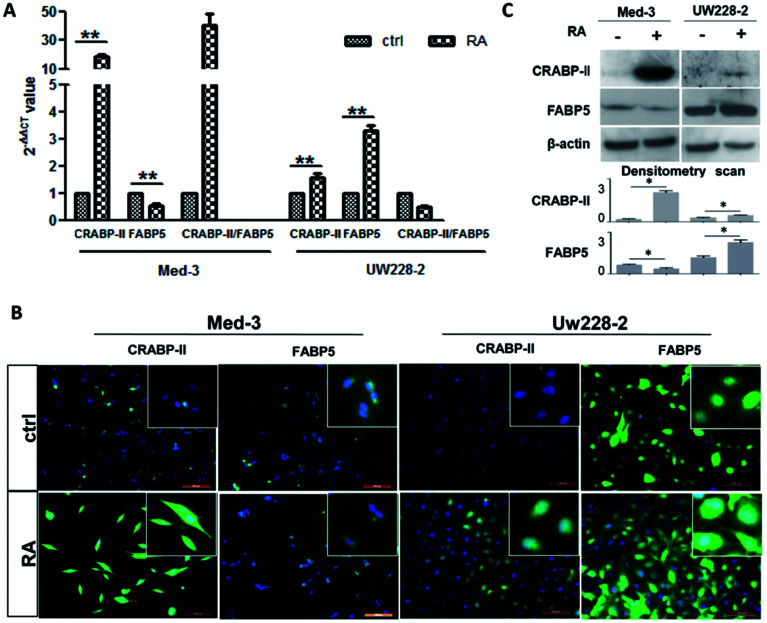
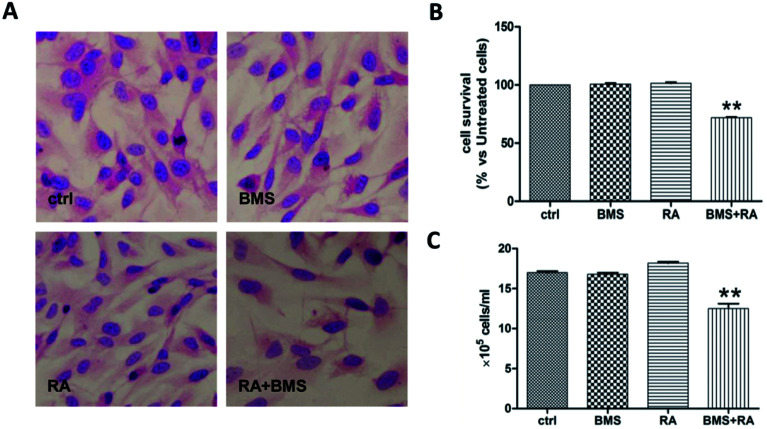
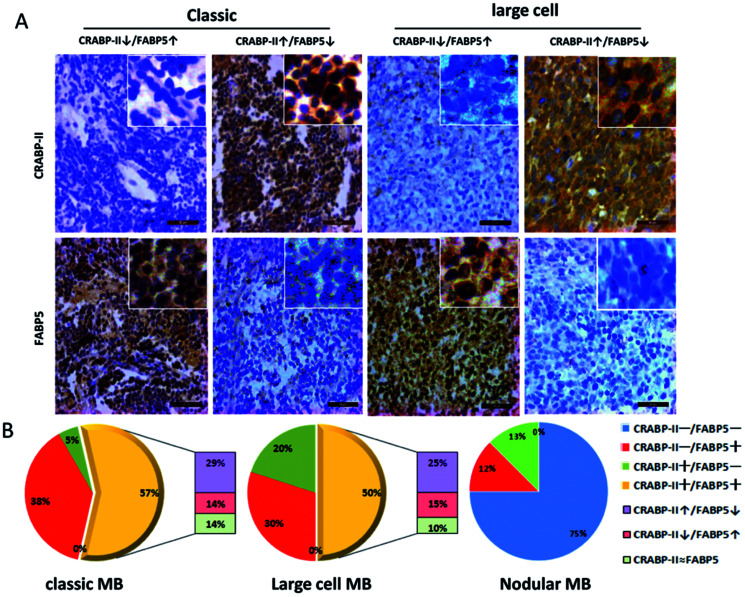
Medulloblastoma (MB) cells exhibit different responses to retinoid acid (RA) for reasons that are poorly understood. RA signaling can be transduced by two approaches that are mediated by cellular retinoic acid-binding protein 2 (CRABP-II) as a tumor-suppressive pathway, and by fatty acid-binding protein 5 (FABP5) as a tumor-promoting pathway. The biological effects of RA on cancer cells are largely determined by the patterns of CRABP-II and FABP5 expression. This study aims to profile the statuses of CRABP-II and FABP5 expression in MB and to evaluate their correlation with RA sensitivities using RA-sensitive (Med-3) and RA-insensitive (UW228-2, UW228-3) MB cells. Our results show that CRABP-II is distinctly expressed and the level of FABP5 is extremely low in Med-3 cells, while the patterns of CRABP-II and FABP5 expression are reversed in UW228-2 and UW228-3 cells. RA up-regulates CRABP-II expression in Med-3 cells, whereas it up-regulates FABP5 expression in the other two cell lines. The FABP5-specific inhibitor BMS309403 increases the RA sensitivity of UW228-2 cells (p < 0.01). Tissue microarray-based immunohistochemical staining showed CRABP-II/FABP5 expression patterns in MB that were variable (CRABP-II-/FABP5-, CRABP-II-/FABP5+, CRABP-II+/FABP5- and CRABP-II+/FABP5+) and imbalanced (CRABP-II↑/FABP5↓ and CRABP-II↓/FABP5↑). MB cases exhibited patterns ofCRABP-II-/FABP5- (12.24%, 6/49), CRABP-II-/FABP5+ (30.61%, 15/49) or CRABP-II↓/FABP5↑ (12.24%, 6/49), implicating unresponsiveness or insensitivity to RA. In conclusion, the ratios of CRABP-II/FABP5 levels are closely related to the RA sensitivities of MB cells. The differential CRABP-II and FABP5 expression patterns are prospective parameters, and of potential value in personalized RA therapy for MB.
This journal is © The Royal Society of Chemistry.
Conflict of interest statement
There are no conflicts to declare.
Figures
Similar articles
-
CRABP-II methylation: a critical determinant of retinoic acid resistance of medulloblastoma cells.Mol Oncol. 2012 Feb;6(1):48-61. doi: 10.1016/j.molonc.2011.11.004. Epub 2011 Nov 25. Mol Oncol. 2012. PMID: 22153617 Free PMC article.
-
CRABP-II- and FABP5-independent responsiveness of human glioblastoma cells to all-trans retinoic acid.Oncotarget. 2015 Mar 20;6(8):5889-902. doi: 10.18632/oncotarget.3334. Oncotarget. 2015. PMID: 25797252 Free PMC article.
-
CRABP-II- and FABP5-independent all-trans retinoic acid resistance in COLO 16 human cutaneous squamous cancer cells.Exp Dermatol. 2012 Jan;21(1):13-8. doi: 10.1111/j.1600-0625.2011.01392.x. Epub 2011 Nov 14. Exp Dermatol. 2012. PMID: 22082219
-
Constitutive expression of cellular retinoic acid binding protein II and lack of correlation with sensitivity to all-trans retinoic acid in acute promyelocytic leukemia cells.Cancer Res. 1998 Dec 15;58(24):5770-6. Cancer Res. 1998. PMID: 9865735
-
Cellular retinoid binding-proteins, CRBP, CRABP, FABP5: Effects on retinoid metabolism, function and related diseases.Pharmacol Ther. 2017 May;173:19-33. doi: 10.1016/j.pharmthera.2017.01.004. Epub 2017 Jan 27. Pharmacol Ther. 2017. PMID: 28132904 Free PMC article. Review.
Cited by
-
Ubiquitination in lipid metabolism reprogramming: implications for pediatric solid tumors.Front Immunol. 2025 Apr 30;16:1554311. doi: 10.3389/fimmu.2025.1554311. eCollection 2025. Front Immunol. 2025. PMID: 40370434 Free PMC article. Review.
-
Significance of stress keratin expression in normal and diseased epithelia.iScience. 2024 Jan 5;27(2):108805. doi: 10.1016/j.isci.2024.108805. eCollection 2024 Feb 16. iScience. 2024. PMID: 38299111 Free PMC article.
-
One-year longitudinal study of the stratum corneum proteome of retinol and all-trans-retinoic acid treated human skin: an orchestrated molecular event.Sci Rep. 2023 Jul 11;13(1):11196. doi: 10.1038/s41598-023-37750-5. Sci Rep. 2023. PMID: 37433822 Free PMC article.
-
Cross-sectional study of proteomic differences between moderate and severe psoriasis.Sci Rep. 2025 Jan 27;15(1):3387. doi: 10.1038/s41598-025-87252-9. Sci Rep. 2025. PMID: 39870771 Free PMC article.
References
LinkOut - more resources
Full Text Sources
Research Materials
Miscellaneous