

Tropisetron modulates peripheral and central serotonin/insulin levels via insulin and nuclear factor kappa B/receptor for advanced glycation end products signalling to regulate type-2 diabetes in rats
- PMID: 35539384
- PMCID: PMC9079279
- DOI: 10.1039/c7ra13105d
Tropisetron modulates peripheral and central serotonin/insulin levels via insulin and nuclear factor kappa B/receptor for advanced glycation end products signalling to regulate type-2 diabetes in rats
Abstract
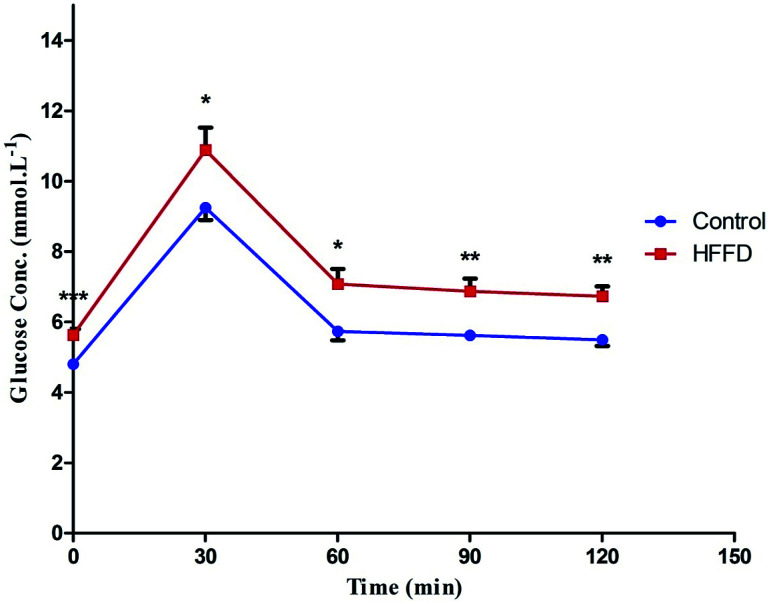
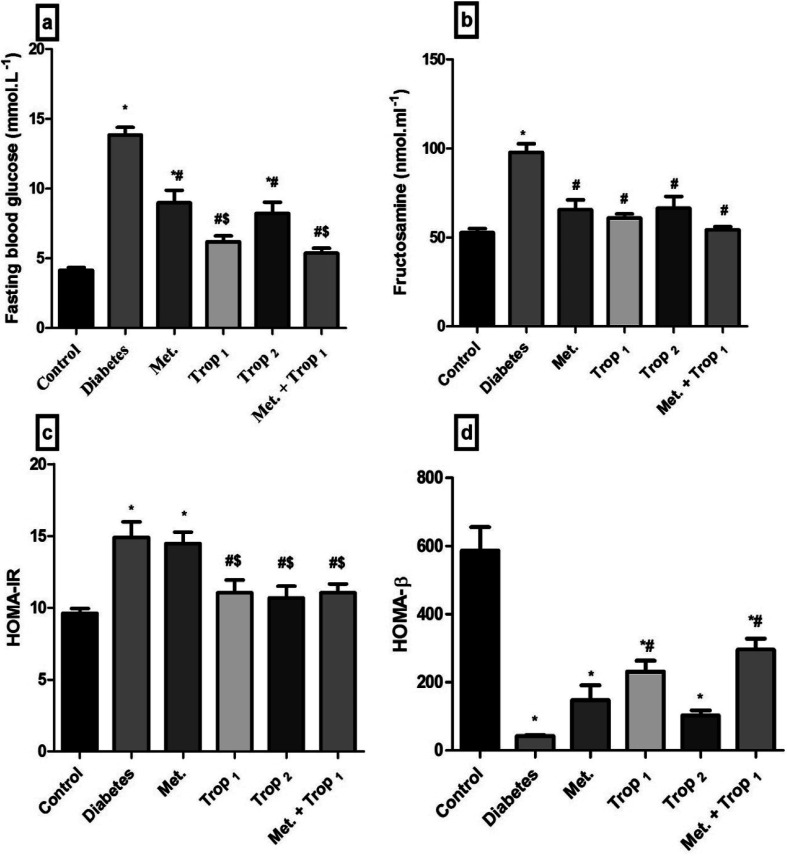
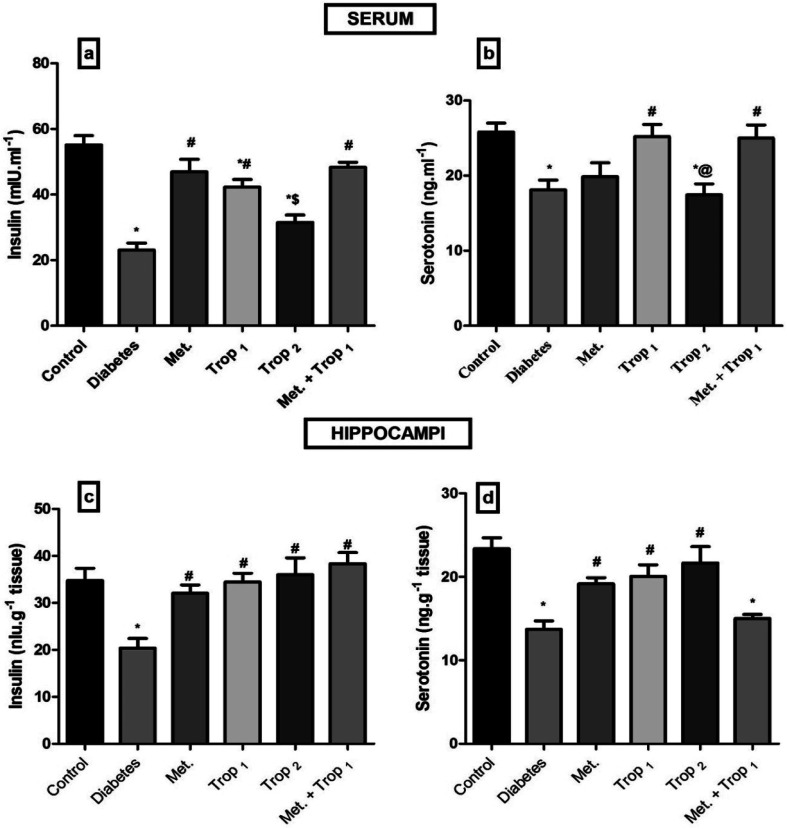
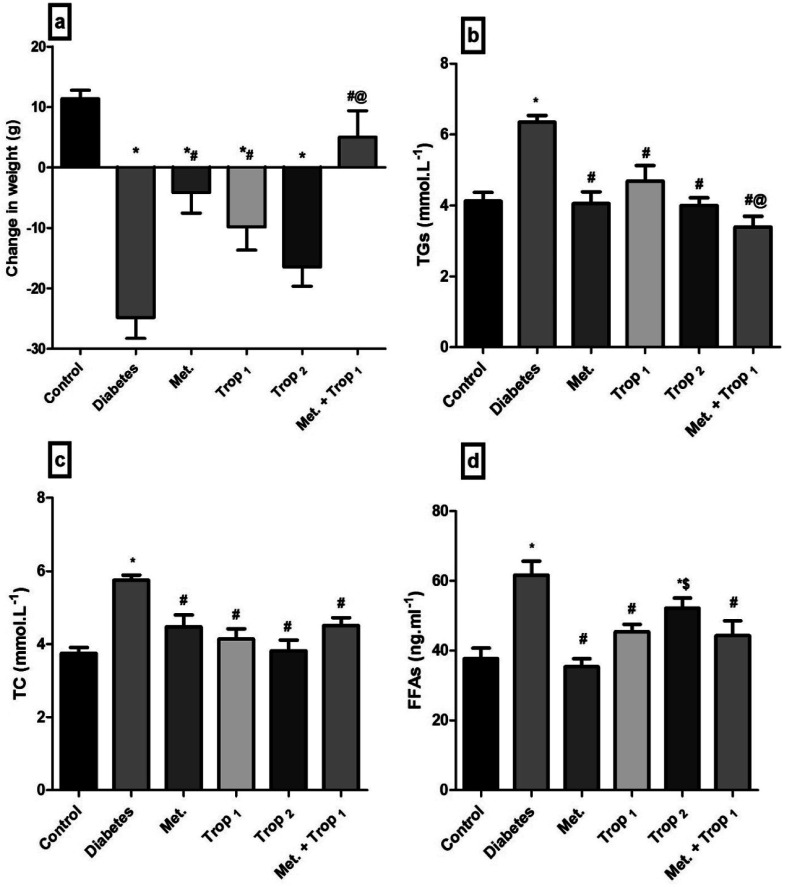
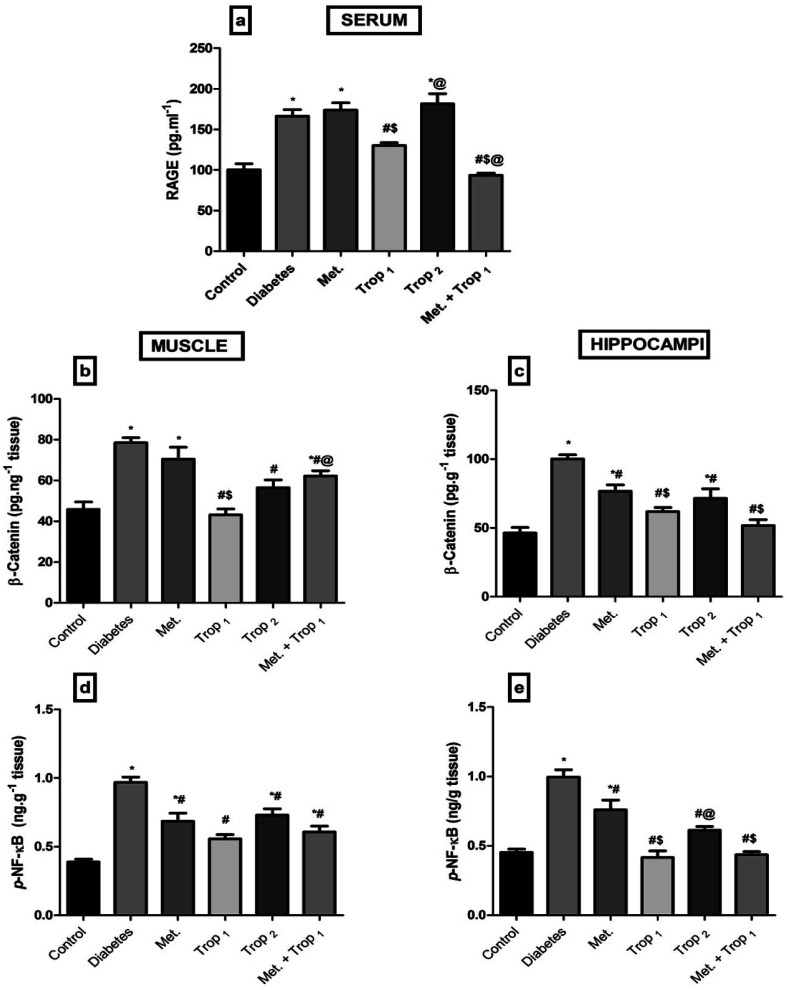
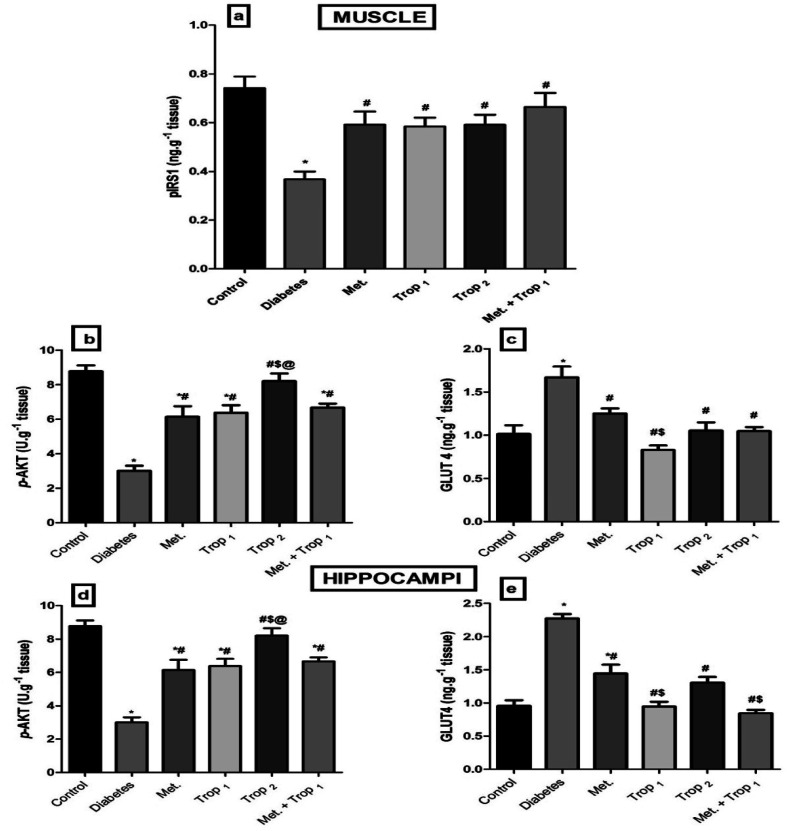
Despite its known central effect, 5% of serotonin is found centrally, while around 95% is found peripherally. Serotonin is stored and co-released with insulin upon pancreatic islets stimulation by glucose. This fact raises the curiosity regarding its possible role in diabetes. Hence, in this study, we assessed the possible modulatory effects of tropisetron, a 5-HT3 receptor antagonist, on type 2 diabetes mellitus models in rats. The rats were allocated into two groups: normal and diabetic. The latter group was treated with metformin (500 mg kg-1, p.o.), tropisetron (1 and 2 mg kg-1, i.p.), and a combination of metformin and tropisetron (1 mg kg-1). The different treatment regimens corrected glucose and lipid homeostasis manifested by the decrease in serum levels of glucose, fructosamine, homeostasis model of insulin resistance, triglycerides, total cholesterol, free fatty acid, as well as receptor for advanced glycation end products. Additionally, the treatments elevated levels of insulin, serotonin, and homeostasis model of β-cell function. On the molecular level, treatments corrected the altered insulin signaling cascade (phosphorylated insulin receptor substrate 1, phosphorylated protein kinase B, and glucose transporter 4), and inhibited β-catenin and phosphorylated nuclear factor kappa B p65 in the assessed soleus skeletal muscle. A similar pattern was duplicated in the hippocampus. This study provided evidence for the role of tropisetron on type 2 diabetes mellitus via modulating the insulin signaling cascade (insulin, phosphorylated insulin receptor substrate 1, phosphorylated protein kinase B, and glucose transporter 4), improving lipid/glucose profile, decreasing inflammatory markers (receptor for advanced glycation end products, and phosphorylated nuclear factor kappa B p65), as well as increasing 5-HT and reducing β-catenin.
This journal is © The Royal Society of Chemistry.
Conflict of interest statement
There are no conflicts of interest to declare.
Figures
Similar articles
-
[Study on effect of gypenosides on insulin sensitivity of rats with diabetes mellitus via regulating NF-κB signaling pathway].Zhongguo Zhong Yao Za Zhi. 2021 Sep;46(17):4488-4496. doi: 10.19540/j.cnki.cjcmm.20210527.401. Zhongguo Zhong Yao Za Zhi. 2021. PMID: 34581054 Chinese.
-
Tropisetron improves pancreas function and increases insulin synthesis and secretion in the STZ-induced diabetic rats: involvement of UCP2/ZnT8 pathway.J Pharm Pharmacol. 2020 Aug;72(8):1082-1091. doi: 10.1111/jphp.13278. Epub 2020 Apr 29. J Pharm Pharmacol. 2020. PMID: 32349166
-
Intrauterine hyperglycemia-induced inflammatory signalling via the receptor for advanced glycation end products in the cardiac muscle of the infants of diabetic mother rats.Eur J Nutr. 2018 Dec;57(8):2701-2712. doi: 10.1007/s00394-017-1536-6. Epub 2017 Sep 23. Eur J Nutr. 2018. PMID: 28942514
-
Recent advances in understanding the anti-diabetic actions of dietary flavonoids.J Nutr Biochem. 2013 Nov;24(11):1777-89. doi: 10.1016/j.jnutbio.2013.06.003. Epub 2013 Sep 9. J Nutr Biochem. 2013. PMID: 24029069 Free PMC article. Review.
-
Advanced Glycation End Products and Diabetes Mellitus: Mechanisms and Perspectives.Biomolecules. 2022 Apr 4;12(4):542. doi: 10.3390/biom12040542. Biomolecules. 2022. PMID: 35454131 Free PMC article. Review.
Cited by
-
Palonosetron/Methyllycaconitine Deactivate Hippocampal Microglia 1, Inflammasome Assembly and Pyroptosis to Enhance Cognition in a Novel Model of Neuroinflammation.Molecules. 2021 Aug 21;26(16):5068. doi: 10.3390/molecules26165068. Molecules. 2021. PMID: 34443654 Free PMC article.
-
Single-Cell Study of Two Rat Models of Pulmonary Arterial Hypertension Reveals Connections to Human Pathobiology and Drug Repositioning.Am J Respir Crit Care Med. 2021 Apr 15;203(8):1006-1022. doi: 10.1164/rccm.202006-2169OC. Am J Respir Crit Care Med. 2021. PMID: 33021809 Free PMC article.
-
Evaluation of the effect of intraoperative tropisetron on postoperative rebound pain after brachial plexus block: a randomized controlled trial.Pain Rep. 2024 May 15;9(3):e1163. doi: 10.1097/PR9.0000000000001163. eCollection 2024 Jun. Pain Rep. 2024. PMID: 38756786 Free PMC article.
-
Neurotransmitter 5-HT Further Promotes LL-37-Induced Rosacea-like Inflammation Through HTR3A.Int J Mol Sci. 2025 Mar 28;26(7):3156. doi: 10.3390/ijms26073156. Int J Mol Sci. 2025. PMID: 40243950 Free PMC article.
-
Tryptophan and serotonin levels as potent biomarkers in diabetes mellitus complications: a new approach of diagnostic role.J Diabetes Metab Disord. 2022 Jul 18;21(2):1923-1934. doi: 10.1007/s40200-022-01096-y. eCollection 2022 Dec. J Diabetes Metab Disord. 2022. PMID: 36404840 Free PMC article. Review.
References
-
- Tseung J. Pathology. 2005;37:190. doi: 10.1080/00313020500059191. - DOI
LinkOut - more resources
Full Text Sources