

Pitch-tunable pillar arrays for high-throughput culture and immunohistological analysis of tumor spheroids
- PMID: 35539534
- PMCID: PMC9077751
- DOI: 10.1039/c7ra09090k
Pitch-tunable pillar arrays for high-throughput culture and immunohistological analysis of tumor spheroids
Abstract
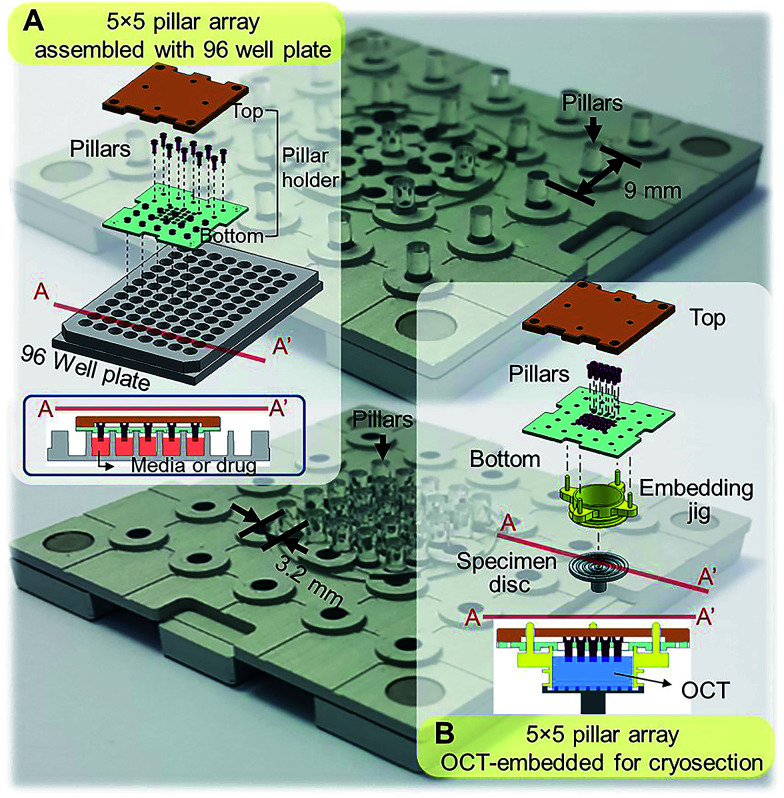
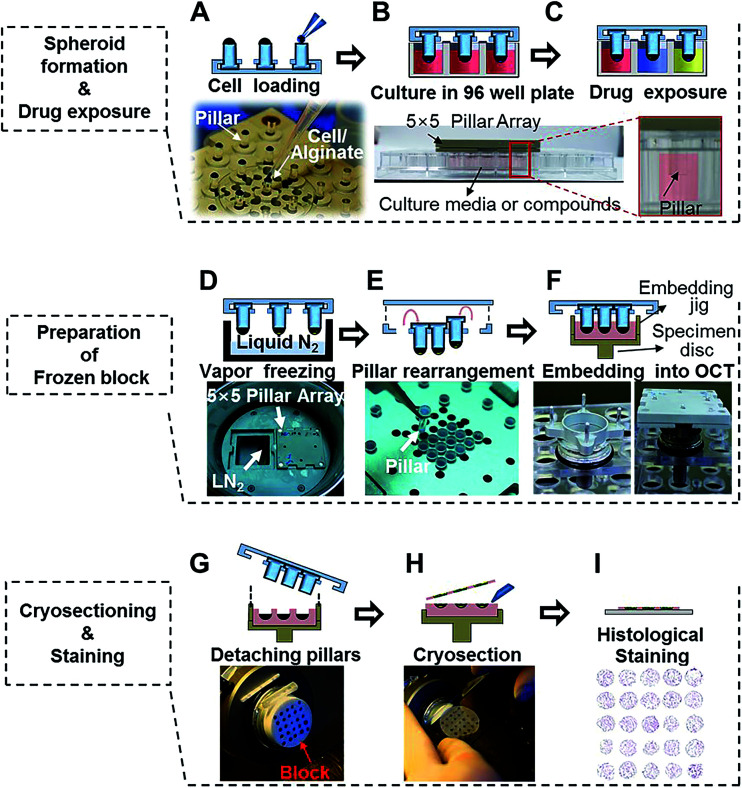
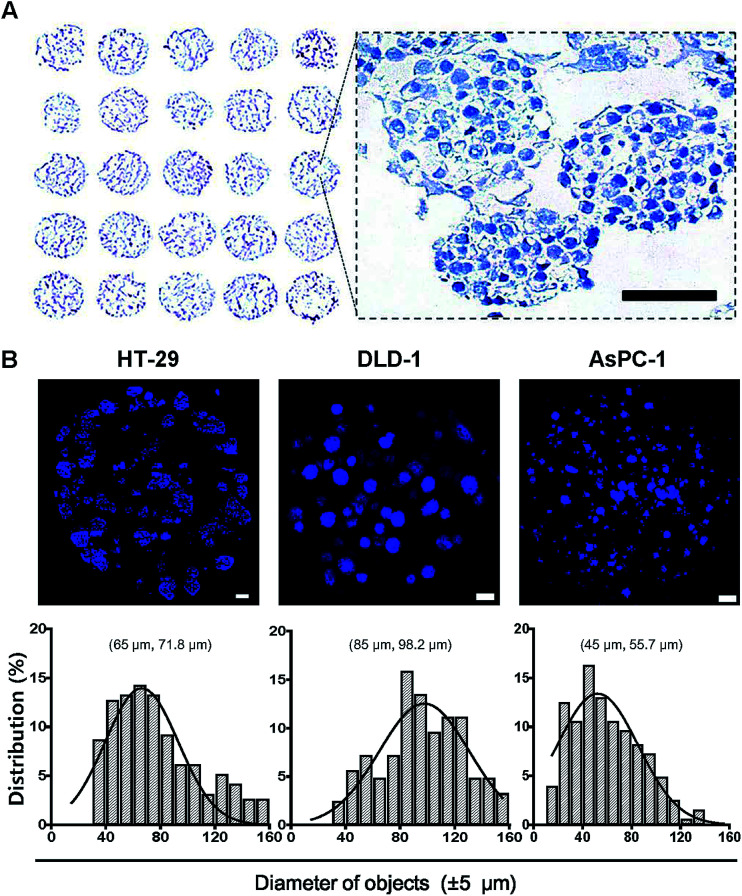
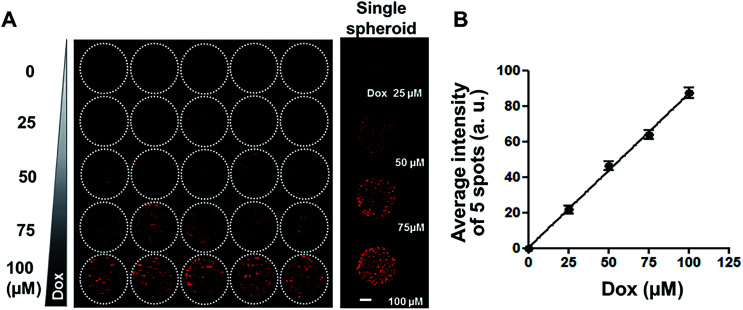
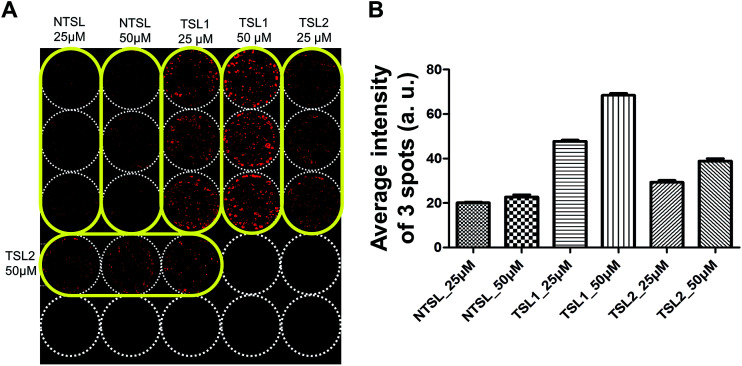
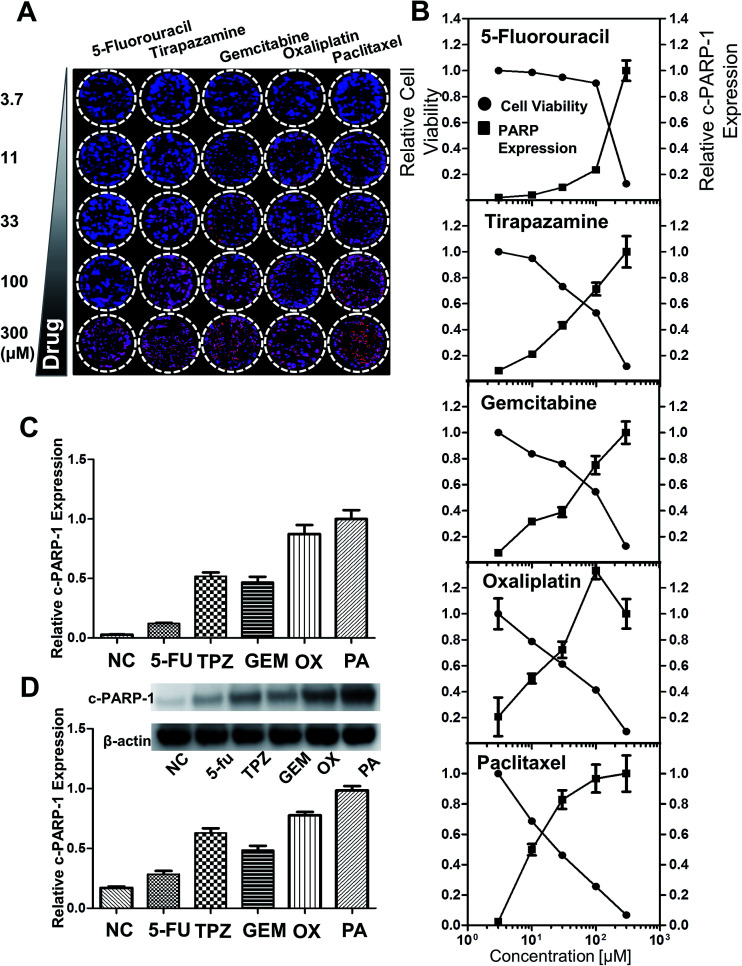
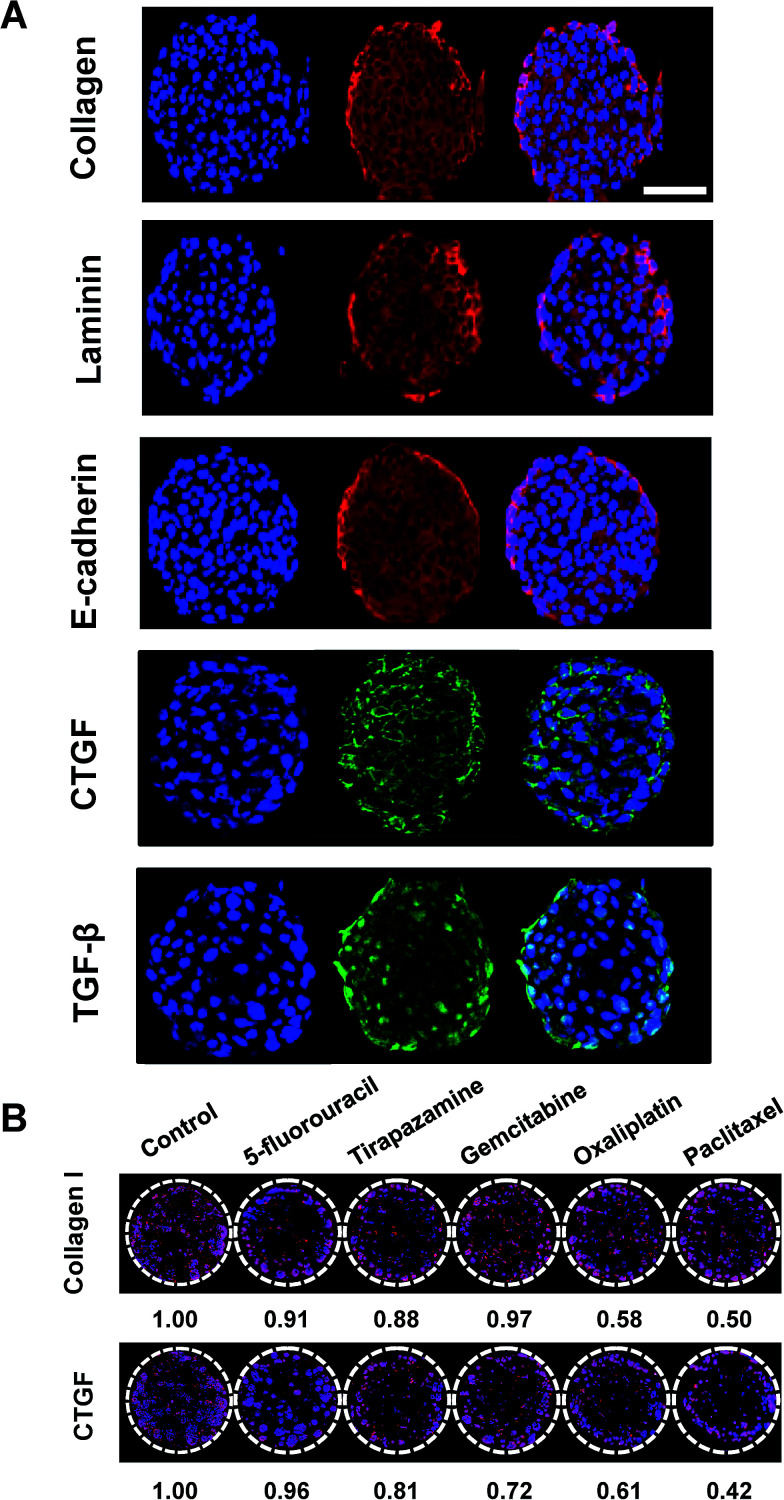
Tumor spheroids are multicellular, three-dimensional (3D) cell culture models closely mimicking the microenvironments of human tumors in vivo, thereby providing enhanced predictability, clinical relevancy of drug efficacy and the mechanism of action. Conventional confocal microscopic imaging remains inappropriate for immunohistological analysis due to current technical limits in immunostaining using antibodies and imaging cells grown in 3D multicellular contexts. Preparation of microsections of these spheroids represents a best alternative, yet their sub-millimeter size and fragility make it less practical for high-throughput screening. To address these problems, we developed a pitch-tunable 5 × 5 mini-pillar array chip for culturing and sectioning tumor spheroids in a high throughput manner. Tumor spheroids were 3D cultured in an alginate matrix using a twenty-five mini-pillar array which aligns to a 96-well. At least a few tens of spheroids per pillar were cultured and as many as 25 different treatment conditions per chip were evaluated, which indicated the high throughput manner of the 5 × 5 pillar array chip. The twenty-five mini-pillars were then rearranged to a transferring pitch so that spheroid-containing gel caps from all pillars can be embedded into a specimen block. Tissue array sections were then prepared and stained for immunohistological examination. The utility of this pitch-tunable pillar array was demonstrated by evaluating drug distribution and expression levels of several proteins following drug treatment in 3D tumor spheroids. Overall, our mini-pillar array provides a novel platform that can be useful for culturing tumor spheroids as well as for immunohistological analysis in a multiplexed and high throughput manner.
This journal is © The Royal Society of Chemistry.
Conflict of interest statement
There are no conflicts of interest to declare.
Figures
Similar articles
-
Mini-pillar array for hydrogel-supported 3D culture and high-content histologic analysis of human tumor spheroids.Lab Chip. 2016 Jun 21;16(12):2265-76. doi: 10.1039/c6lc00526h. Epub 2016 May 19. Lab Chip. 2016. PMID: 27194205
-
High-throughput culture and embedment of spheroid array using droplet contact-based spheroid transfer.Biomicrofluidics. 2018 Jul 18;12(4):044109. doi: 10.1063/1.5039965. eCollection 2018 Jul. Biomicrofluidics. 2018. PMID: 30867862 Free PMC article.
-
Construction of a Fibroblast-Associated Tumor Spheroid Model Based on a Collagen Drop Array Chip.Biosensors (Basel). 2021 Dec 9;11(12):506. doi: 10.3390/bios11120506. Biosensors (Basel). 2021. PMID: 34940263 Free PMC article.
-
The production of 3D tumor spheroids for cancer drug discovery.Drug Discov Today Technol. 2017 Mar;23:27-36. doi: 10.1016/j.ddtec.2017.03.002. Epub 2017 Apr 14. Drug Discov Today Technol. 2017. PMID: 28647083 Free PMC article. Review.
-
High-throughput screening in multicellular spheroids for target discovery in the tumor microenvironment.Expert Opin Drug Discov. 2020 Aug;15(8):955-967. doi: 10.1080/17460441.2020.1756769. Epub 2020 May 4. Expert Opin Drug Discov. 2020. PMID: 32364413 Review.
Cited by
-
Multiplex quantitative analysis of stroma-mediated cancer cell invasion, matrix remodeling, and drug response in a 3D co-culture model of pancreatic tumor spheroids and stellate cells.J Exp Clin Cancer Res. 2019 Jun 14;38(1):258. doi: 10.1186/s13046-019-1225-9. J Exp Clin Cancer Res. 2019. PMID: 31200779 Free PMC article.
-
Three-Dimensional Imaging for Multiplex Phenotypic Analysis of Pancreatic Microtumors Grown on a Minipillar Array Chip.Cancers (Basel). 2020 Dec 7;12(12):3662. doi: 10.3390/cancers12123662. Cancers (Basel). 2020. PMID: 33297288 Free PMC article.
-
Modeling the Role of Cancer-Associated Fibroblasts in Tumor Cell Invasion.Cancers (Basel). 2022 Feb 15;14(4):962. doi: 10.3390/cancers14040962. Cancers (Basel). 2022. PMID: 35205707 Free PMC article. Review.
-
CXCL chemokines-mediated communication between macrophages and BMSCs on titanium surface promotes osteogenesis via the actin cytoskeleton pathway.Mater Today Bio. 2023 Oct 5;23:100816. doi: 10.1016/j.mtbio.2023.100816. eCollection 2023 Dec. Mater Today Bio. 2023. PMID: 37859997 Free PMC article.
-
Metabolic flux analysis of 3D spheroids reveals significant differences in glucose metabolism from matched 2D cultures of colorectal cancer and pancreatic ductal adenocarcinoma cell lines.Cancer Metab. 2022 May 16;10(1):9. doi: 10.1186/s40170-022-00285-w. Cancer Metab. 2022. PMID: 35578327 Free PMC article.
References
-
- Lee D. W. Yi S. H. Jeong S. H. Ku B. Kim J. Lee M. Y. Sens. Actuators, B. 2013;177:78–85. doi: 10.1016/j.snb.2012.10.129. - DOI
LinkOut - more resources
Full Text Sources
Other Literature Sources
Miscellaneous