High rate capability by sulfur-doping into LiFePO4 matrix
- PMID: 35539603
- PMCID: PMC9078183
- DOI: 10.1039/c7ra12740e
High rate capability by sulfur-doping into LiFePO4 matrix
Abstract
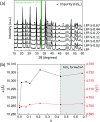
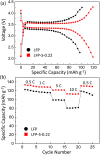
Enhanced electrochemical performance of LiFePO4 for Li-ion batteries has been anticipated by anion doping at the O-site rather than cation doping at the Fe-site. We report on the electrochemical performance of S-doped LiFePO4 nanoparticles synthesized by a solvothermal method using thioacetamide as a sulfur source. S-doping into the LiFePO4 matrix expands the lattice due to the larger ionic radius of S2- than that of O2-. The lattice parameters a and b increase by around 0.2% with sulfur content, while that of c remains almost unchanged with only 0.03% increase. The S-doping also contributes to the suppression of antisite defects (Fe occupying Li sites), which facilitates the easy migration of Li in the diffusion channels without blockage. Owing to these effects of S-doping, the S-doped LiFePO4 nanoparticles show enhanced electrochemical properties with a high discharge capacity of ∼113 mA h g-1 even at a high rate of 10C.
This journal is © The Royal Society of Chemistry.
Conflict of interest statement
There are no conflicts to declare.
Figures


Similar articles
-
A First-Principles Study of Anion Doping in LiFePO4 Cathode Materials for Li-Ion Batteries.Chemphyschem. 2024 Feb 1;25(3):e202300756. doi: 10.1002/cphc.202300756. Epub 2023 Dec 13. Chemphyschem. 2024. PMID: 38010194
-
Correlation Between Li-Fe Anti-Site and Memory Effect of LiFePO4 in Li-Ion Batteries.Chem Asian J. 2024 Jul 15;19(14):e202400181. doi: 10.1002/asia.202400181. Epub 2024 Jun 12. Chem Asian J. 2024. PMID: 38705859
-
One-Pot Synthesis of LiFePO4/N-Doped C Composite Cathodes for Li-ion Batteries.Materials (Basel). 2022 Jul 6;15(14):4738. doi: 10.3390/ma15144738. Materials (Basel). 2022. PMID: 35888204 Free PMC article.
-
A Synergistic Effect of Na+ and Al3+ Dual Doping on Electrochemical Performance and Structural Stability of LiNi0.88Co0.08Mn0.04O2 Cathodes for Li-Ion Batteries.ACS Appl Mater Interfaces. 2022 Feb 2;14(4):5168-5176. doi: 10.1021/acsami.1c16042. Epub 2022 Jan 18. ACS Appl Mater Interfaces. 2022. PMID: 35041400
-
Controlled Hydrothermal/Solvothermal Synthesis of High-Performance LiFePO4 for Li-Ion Batteries.Small Methods. 2021 Jun;5(6):e2100193. doi: 10.1002/smtd.202100193. Epub 2021 May 7. Small Methods. 2021. PMID: 34927913 Review.
Cited by
-
High electrochemical performance of nanocrystallized carbon-coated LiFePO4 modified by tris(pentafluorophenyl) borane as a cathode material for lithium-ion batteries.RSC Adv. 2018 Aug 14;8(51):28978-28986. doi: 10.1039/c8ra04119a. eCollection 2018 Aug 14. RSC Adv. 2018. PMID: 35547964 Free PMC article.
-
Shape Matters: The Effect of Particle Morphology on the Fast-Charging Performance of LiFePO4/C Nanoparticle Composite Electrodes.ACS Omega. 2021 Sep 9;6(37):24062-24069. doi: 10.1021/acsomega.1c03432. eCollection 2021 Sep 21. ACS Omega. 2021. PMID: 34568684 Free PMC article.
-
Modification of mixed-nitrogen anions configuration for accelerating lithium ions transport in the LiFePO4 electrode.RSC Adv. 2023 Oct 31;13(45):31873-31880. doi: 10.1039/d3ra06242b. eCollection 2023 Oct 26. RSC Adv. 2023. PMID: 37915448 Free PMC article.
-
Doping LiFePO4 with Al3+: Suppression of Anti-Site Defects and Implications for Battery Recycling.ACS Omega. 2025 Jan 6;10(1):1293-1302. doi: 10.1021/acsomega.4c08870. eCollection 2025 Jan 14. ACS Omega. 2025. PMID: 39829455 Free PMC article.
References
-
- Eftekhari A. ACS Sustainable Chem. Eng. 2017;5:2799. doi: 10.1021/acssuschemeng.7b00046. - DOI
-
- Etacheri V. Marom R. Elazari R. Salitra G. Aurbach D. Energy Environ. Sci. 2011;4:3243.
LinkOut - more resources
Full Text Sources
Other Literature Sources

