

Detection of Helicobacter pylori in dental plaque using a DNA biosensor for noninvasive diagnosis
- PMID: 35539942
- PMCID: PMC9080877
- DOI: 10.1039/c8ra03134g
Detection of Helicobacter pylori in dental plaque using a DNA biosensor for noninvasive diagnosis
Abstract
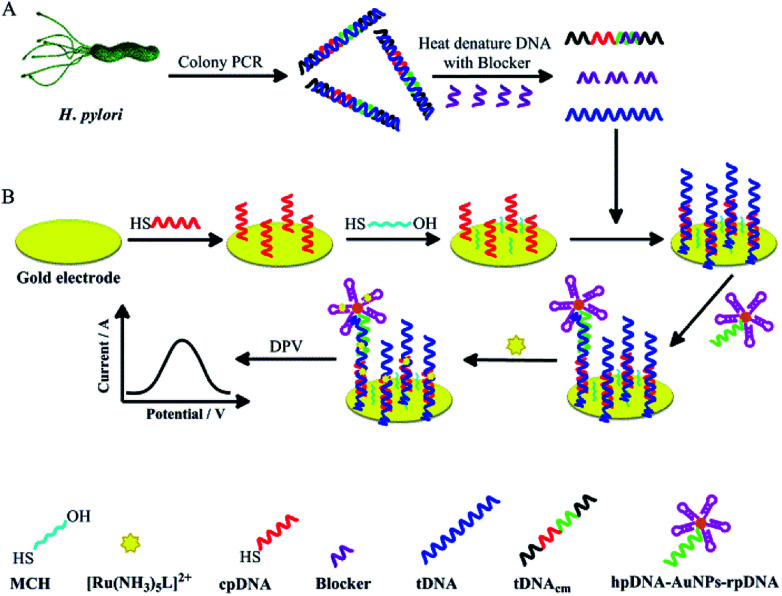
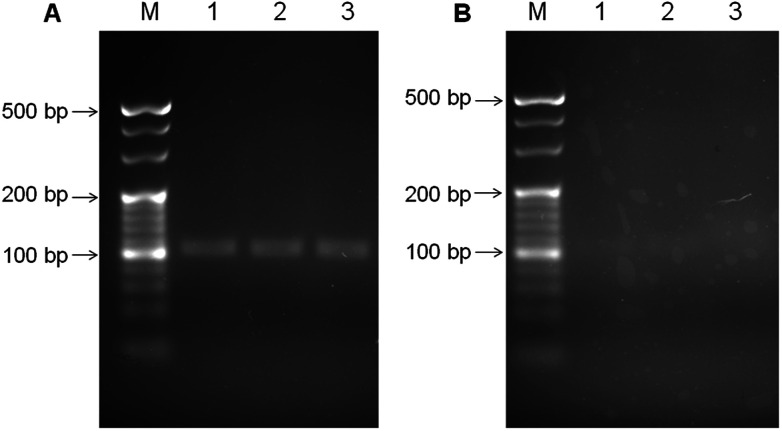
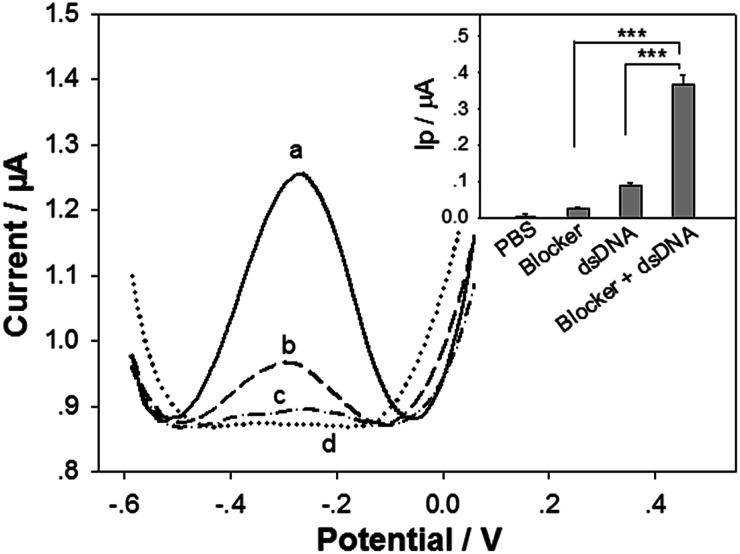
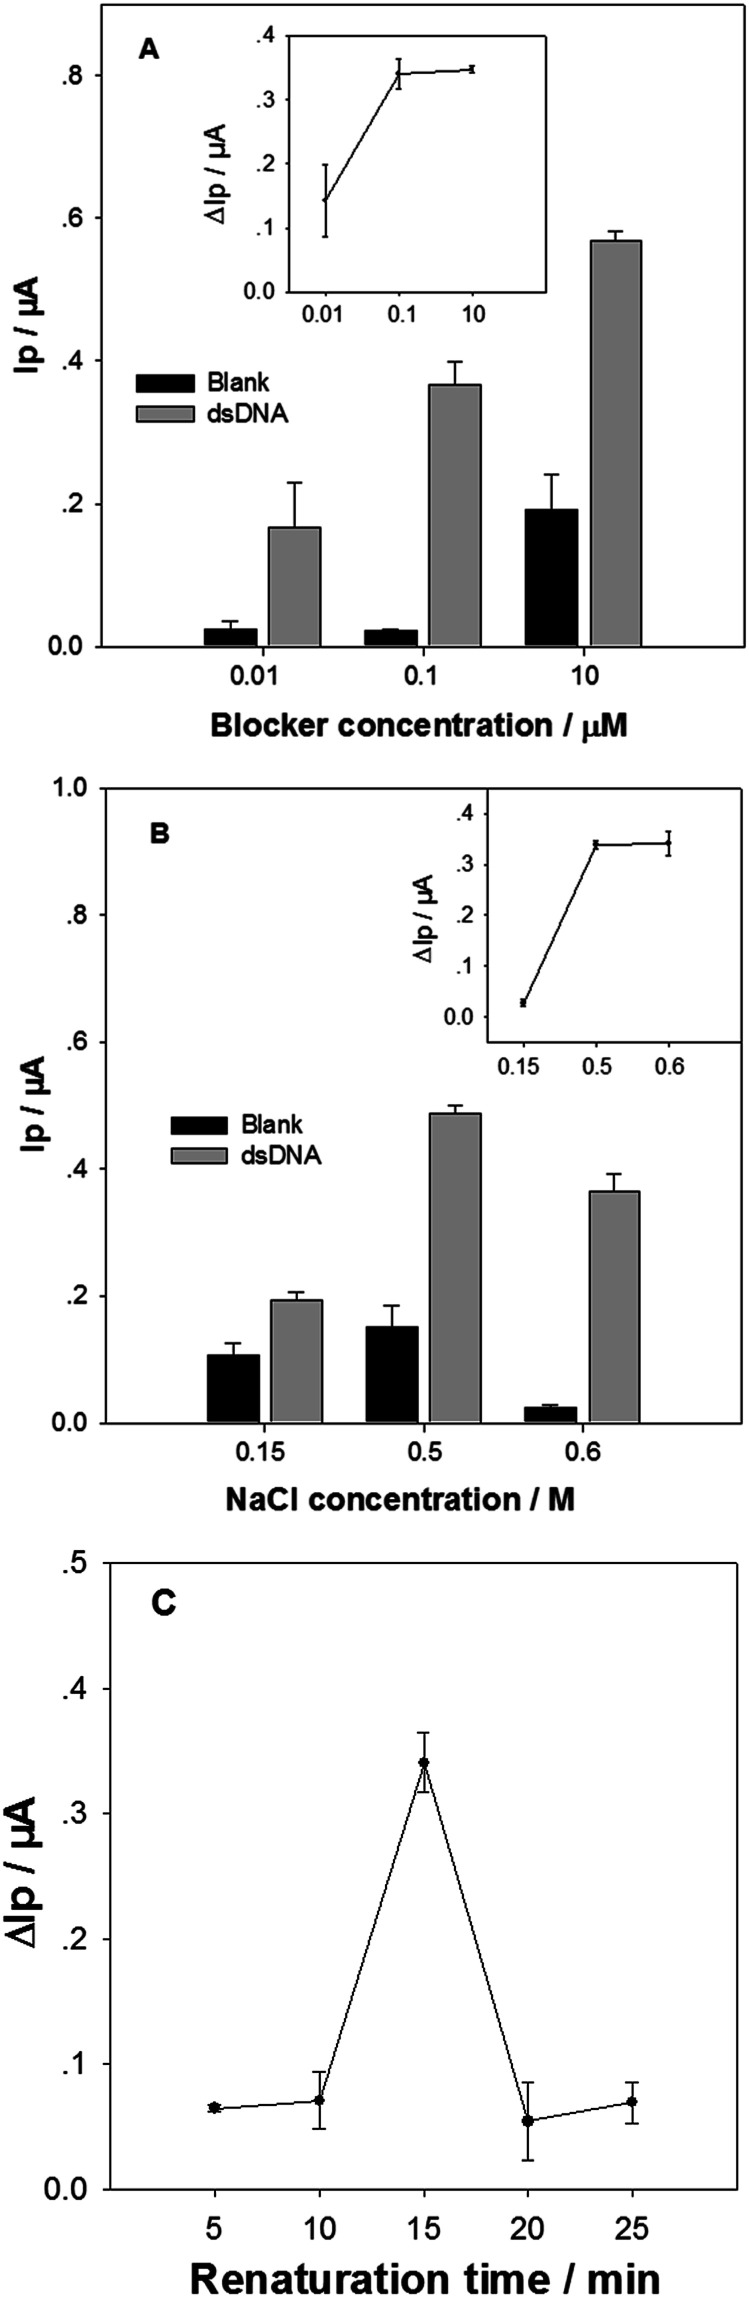
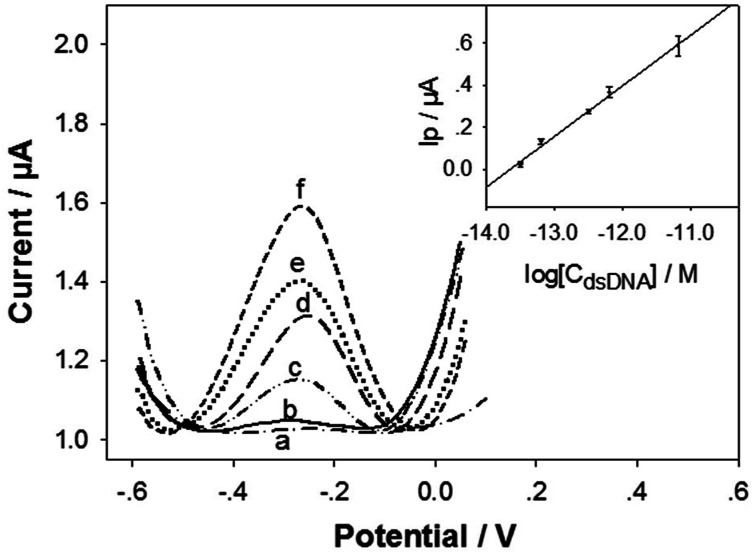
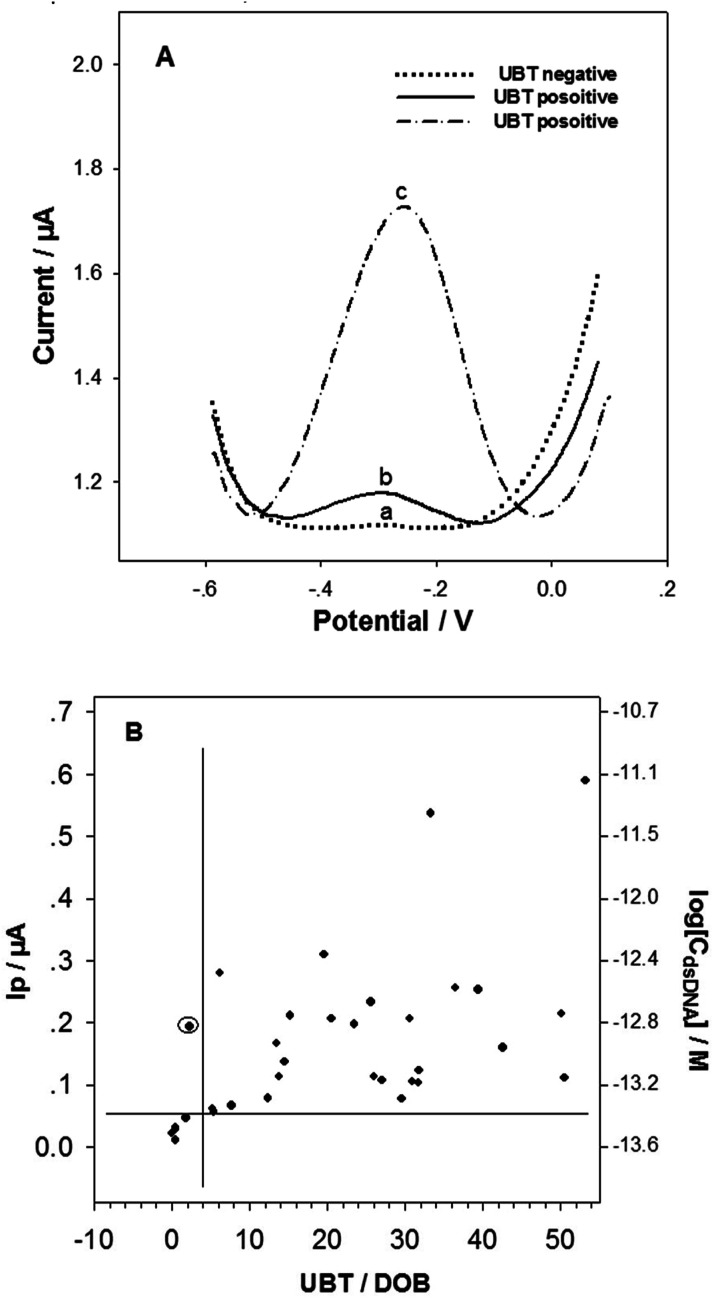
Noninvasive diagnosis of Helicobacter pylori (H. pylori) infection is very attractive. This study investigated the single strand DNA (ssDNA) acquisition method from H. pylori in dental plaque, and the integration of our previously developed 43-mer H. pylori DNA biosensor with the obtained target ssDNA (tDNA). Dental plaque samples were collected from 34 patients/volunteers, whose gastric H. pylori infection statuses were tested with the 13C urea breath test (UBT). The samples were treated with colony polymerase chain reaction (PCR) to obtain double strand DNA (dsDNA) of 104 basepairs (bp) long. A blocker ssDNA was designed and used in thermal treatment of the dsDNA to release the 104-mer tDNA, which contains the 43-mer DNA sequence in the middle. PCR primers were designed, and the tDNA releasing and detection conditions with the biosensor were optimized. The limit of detection with the biosensor was 12 fM dsDNA. The dental plaque detection results correlated quite well with the UBT results, with a sensitivity of 100%, and specificity of 97%. These results indicate that the residence of H. pylori in dental plaque is highly associated with gastric H. pylori infection, and detection of dental plaque samples with our DNA biosensor is promisingly applicable in noninvasive diagnosis of H. pylori infection.
This journal is © The Royal Society of Chemistry.
Conflict of interest statement
There are no conflicts to declare.
Figures
Similar articles
-
DNA diagnostics for reliable and universal identification of Helicobacter pylori.World J Gastroenterol. 2021 Nov 7;27(41):7100-7112. doi: 10.3748/wjg.v27.i41.7100. World J Gastroenterol. 2021. PMID: 34887630 Free PMC article. Review.
-
Evaluation of a new fluorescence quantitative PCR test for diagnosing Helicobacter pylori infection in children.BMC Gastroenterol. 2013 Jan 14;13:7. doi: 10.1186/1471-230X-13-7. BMC Gastroenterol. 2013. PMID: 23311469 Free PMC article.
-
Evaluation of the polymerase chain reaction for detecting the urease C gene of Helicobacter pylori in gastric biopsy samples and dental plaque.J Med Microbiol. 1993 Nov;39(5):338-44. doi: 10.1099/00222615-39-5-338. J Med Microbiol. 1993. PMID: 8246250
-
The clinical utility of string-PCR test in diagnosing Helicobacter pylori infection.Hepatogastroenterology. 2003 Sep-Oct;50(53):1208-13. Hepatogastroenterology. 2003. PMID: 14571700
-
Diagnosis of Helicobacter pylori: what should be the gold standard?World J Gastroenterol. 2014 Sep 28;20(36):12847-59. doi: 10.3748/wjg.v20.i36.12847. World J Gastroenterol. 2014. PMID: 25278682 Free PMC article. Review.
Cited by
-
Characterization of the unique oral microbiome of children harboring Helicobacter pylori in the oral cavity.J Oral Microbiol. 2024 Apr 11;16(1):2339158. doi: 10.1080/20002297.2024.2339158. eCollection 2024. J Oral Microbiol. 2024. PMID: 38617439 Free PMC article.
-
Early detection of oral bacteria causing gum infections and dental caries in children.Iran J Microbiol. 2024 Feb;16(1):49-55. doi: 10.18502/ijm.v16i1.14870. Iran J Microbiol. 2024. PMID: 38682052 Free PMC article.
-
Biosensors for point-of-care testing and personalized monitoring of gastrointestinal microbiota.Front Microbiol. 2023 May 5;14:1114707. doi: 10.3389/fmicb.2023.1114707. eCollection 2023. Front Microbiol. 2023. PMID: 37213495 Free PMC article. Review.
-
Biosensors, modern technology for the detection of cancer-associated bacteria.Biotechnol Lett. 2022 Jun;44(5-6):683-701. doi: 10.1007/s10529-022-03257-8. Epub 2022 May 11. Biotechnol Lett. 2022. PMID: 35543825 Review.
-
Evolution of Diagnostic Methods for Helicobacter pylori Infections: From Traditional Tests to High Technology, Advanced Sensitivity and Discrimination Tools.Diagnostics (Basel). 2022 Feb 16;12(2):508. doi: 10.3390/diagnostics12020508. Diagnostics (Basel). 2022. PMID: 35204598 Free PMC article. Review.
References
-
- Nosrati R. Golichenari B. Nezami A. Taghdisi S. M. Karimi B. Ramezani M. Abnous K. Shaegh S. A. M. Trends Anal. Chem. 2017;97:428–444. doi: 10.1016/j.trac.2017.10.013. - DOI
LinkOut - more resources
Full Text Sources
Miscellaneous