. 2018 Jun 26;8(41):23101-23118.
doi: 10.1039/c8ra03717e. eCollection 2018 Jun 21.

Blast furnace slag-Mg(OH)2 cements activated by sodium carbonate

Affiliations

Blast furnace slag-Mg(OH)2 cements activated by sodium carbonate

Sam A Walling et al. RSC Adv. .

Abstract

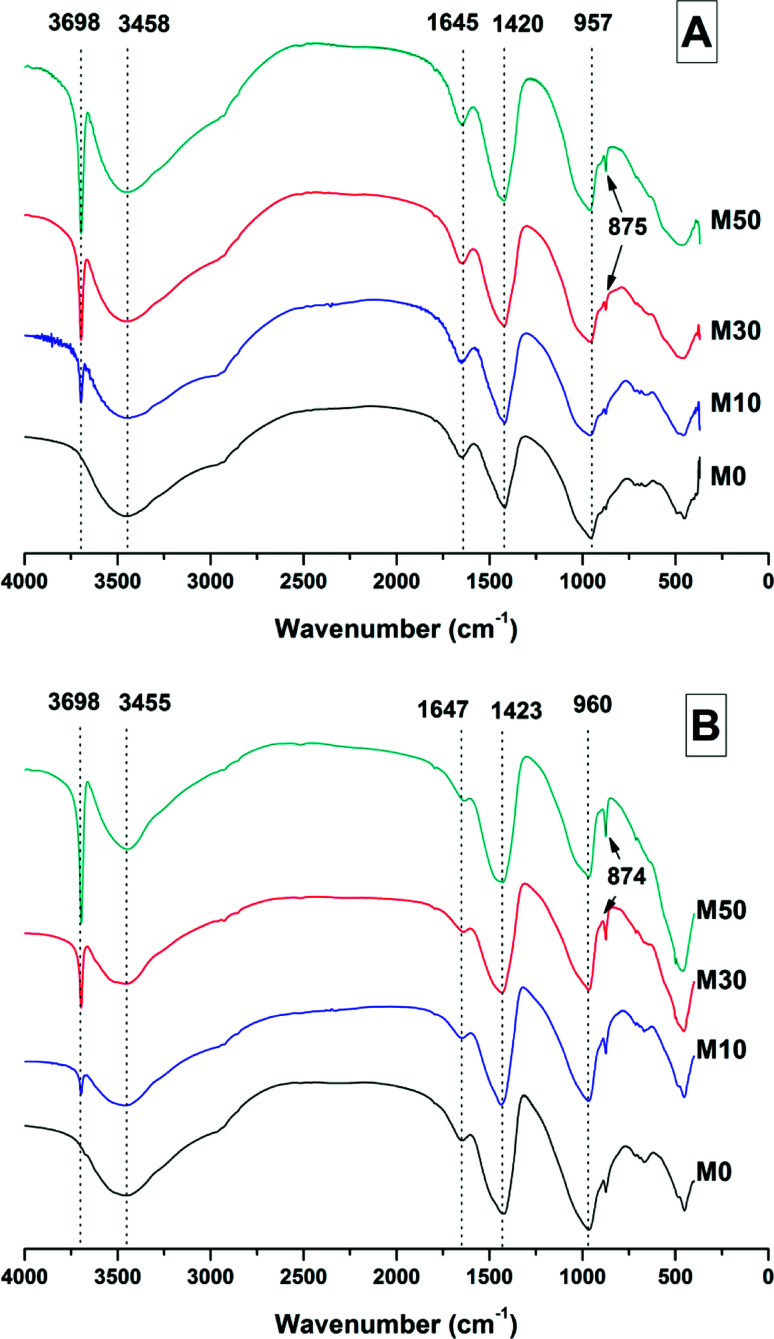
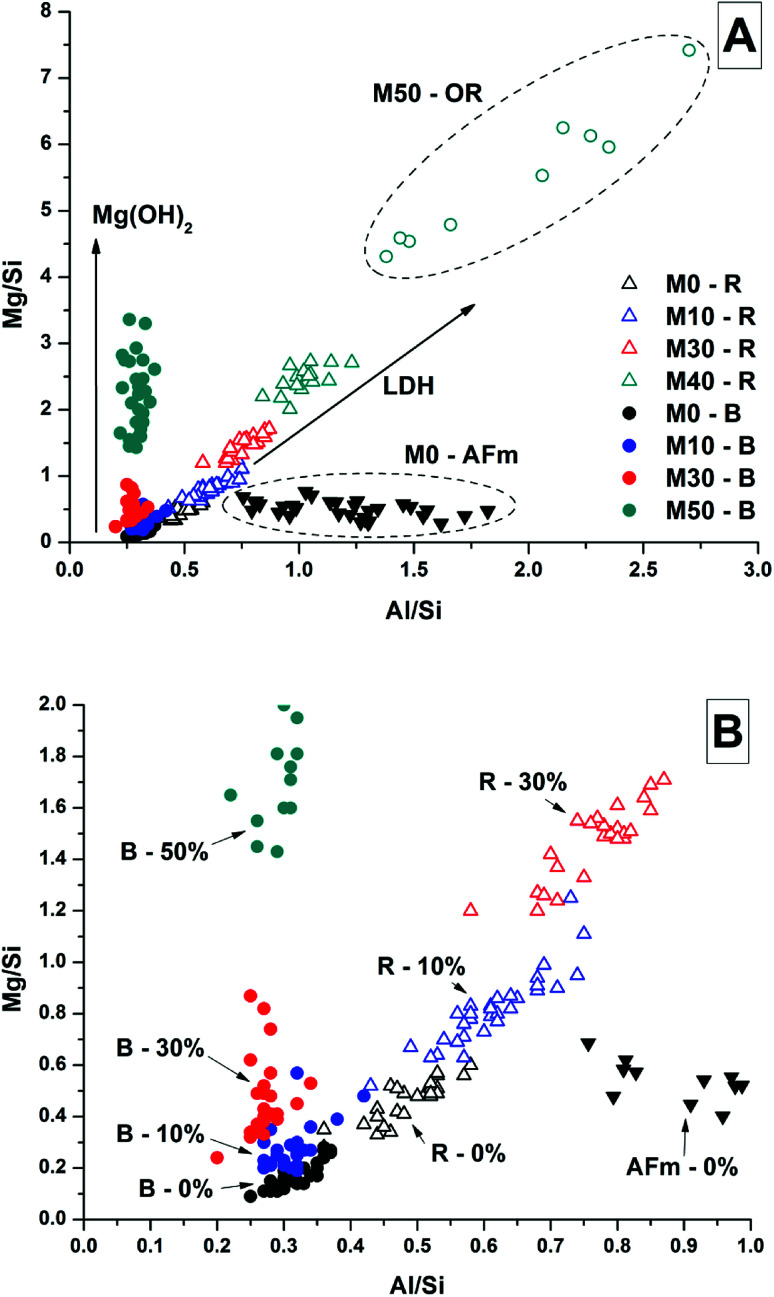
The structural evolution of a sodium carbonate activated slag cement blended with varying quantities of Mg(OH)2 was assessed. The main reaction products of these blended cements were a calcium-sodium aluminosilicate hydrate type gel, an Mg-Al layered double hydroxide with a hydrotalcite type structure, calcite, and a hydrous calcium aluminate phase (tentatively identified as a carbonate-containing AFm structure), in proportions which varied with Na2O/slag ratios. Particles of Mg(OH)2 do not chemically react within these cements. Instead, Mg(OH)2 acts as a filler accelerating the hardening of sodium carbonate activated slags. Although increased Mg(OH)2 replacement reduced the compressive strength of these cements, pastes with 50 wt% Mg(OH)2 still reached strengths of ∼21 MPa. The chemical and mechanical characteristics of sodium carbonate activated slag/Mg(OH)2 cements makes them a potentially suitable matrix for encapsulation of high loadings of Mg(OH)2-bearing wastes such as Magnox sludge.


Conflict of interest statement

There are no conflicts of interest to declare.

Figures

Fig. 1
Fig. 1. Isothermal calorimetry curves (A) and cumulative heat of reaction (B) of a sodium carbonate activated slag cement, normalised to total sample mass, as a function of the Mg(OH)2 content (percentage replacement of GGBS by Mg(OH)2 as marked in legend).
Fig. 2
Fig. 2. Isothermal calorimetry curves (A) and cumulative heat of reaction (B) of a sodium carbonate activated slag cement, normalised to mass of GGBS, as a function of the Mg(OH)2 content (percentage replacement of GGBS by Mg(OH)2 as marked in legend).
Fig. 3
Fig. 3. X-ray diffractograms of sodium carbonate activated slag cements after 1, 3 and 7 days of curing, containing (A) 0 wt%, (B) 10 wt%, (C) 30 wt% and (D) 50 wt% replacement of GGBS by Mg(OH)2. In all graphics, “CSH” indicates the diffuse reflection of calcium silicate hydrate-type gels, in this case substituted by both Na and Al.
Fig. 4
Fig. 4. X-ray diffraction patterns of sodium carbonate activated slag binders after (A) 28 days, and (B) 18 months of curing. The strongest calcite reflections in sample M50 are truncated for visual clarity in presentation.
Fig. 5
Fig. 5. FTIR spectra of sodium carbonate activated slag binders after (A) 28 days, and (B) 18 months of curing.
Fig. 6
Fig. 6. Expanded FTIR spectra of sodium carbonate activated slag binders after 18 months of curing.
Fig. 7
Fig. 7. Thermogravimetric (TG) and differential thermogravimetric (DTG) analysis of samples after (A) 28 days curing and (B) 18 months curing, with M0 DTG data highlighted as an inset to show the characteristic hydrotalcite peaks.
Fig. 8
Fig. 8. MS data for all samples after 18 months curing, (A) combined H2O and CO2, (B) CO2 response.
Fig. 9
Fig. 9. Backscattered electron micrographs ((A) low magnification; (B) higher magnification) and corresponding EDX maps of a sodium carbonate activated slag without Mg(OH)2 addition, after 18 months of curing.
Fig. 10
Fig. 10. Backscattered electron micrographs ((A) low magnification; (B) higher magnification) and corresponding EDX maps of a sodium carbonate activated slag with 10 wt% Mg(OH)2 addition, after 18 months of curing.
Fig. 11
Fig. 11. Backscattered electron micrograph and corresponding EDX maps of a sodium carbonate activated slag with 30 wt% Mg(OH)2 addition, after 18 months of curing.
Fig. 12
Fig. 12. Backscattered electron micrographs (two different regions in A and B) and corresponding EDX maps of a sodium carbonate activated slag with 50 wt% Mg(OH)2 addition, after 18 months of curing.
Fig. 13
Fig. 13. High magnification backscattered electron micrograph and corresponding EDX maps of a sodium carbonate activated slag with 50 wt% Mg(OH)2 addition, after 18 months of curing.
Fig. 14
Fig. 14. Plot of EDX spot map atomic ratios comparing Ca/Si vs. Al/Si in the bulk matrix.
Fig. 15
Fig. 15. Plot of EDX spot map atomic ratios, comparing Mg/Si vs. Al/Si ratios of the 18 months cured sample without added Mg(OH)2 (M0).
Fig. 16
Fig. 16. Plots of EDX spot map atomic ratios, comparing Mg/Si vs. Al/Si ratios of 18 months samples with up to 50% Mg(OH)2. (A) Full plot, (B) enlargement of the lower-left region. Abbreviations used: B = Bulk, R = Rim, OR = outer rim [ro], LDH = layered double hydroxide.
Fig. 17
Fig. 17. Solid state MAS NMR spectra of anhydrous GGBS and sodium carbonate activated slag binders after 18 months of curing, (A) 29Si, (B) 27Al.
Fig. 18
Fig. 18. 29Si MAS NMR spectrum for M50 after 18 months of curing. Simulation and constituent peaks are shown underneath the measured data. Peak assignments are detailed in Table 5.

References

    1. Provis J. L. Bernal S. A. Annu. Rev. Mater. Res. 2014;44:299–327. doi: 10.1146/annurev-matsci-070813-113515. - DOI
    1. Shi C., Krivenko P. V. and Roy D., Alkali-Activated Cements and Concretes, Taylor & Francis, Abingdon, UK, 2006
    1. Bai Y. Collier N. C. Milestone N. B. Yang C. H. J. Nucl. Mater. 2011;413:183–192. doi: 10.1016/j.jnucmat.2011.04.011. - DOI
    1. Bernal S. A. Provis J. L. Myers R. J. San Nicolas R. van Deventer J. S. J. Mater. Struct. 2015;48:517–529. doi: 10.1617/s11527-014-0412-6. - DOI
    1. Bernal S. A. RILEM Tech. Lett. 2016;1:39–44. doi: 10.21809/rilemtechlett.2016.8. - DOI