Kinetically-controlled mechanism-based isolation of metabolic serine hydrolases in active form from complex proteomes: butyrylcholinesterase as a case study
- PMID: 35540231
- PMCID: PMC9075836
- DOI: 10.1039/c9ra07583f
Kinetically-controlled mechanism-based isolation of metabolic serine hydrolases in active form from complex proteomes: butyrylcholinesterase as a case study
Abstract
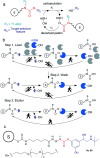
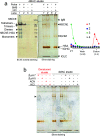
In this work an activity-based probe containing a carbamate group was designed to isolate human butyrylcholinesterase (hBChE), a metabolic serine hydrolase (mSH), from complex proteomes. The method took advantage of the native interaction mechanism of mSHs with carbamate pseudo-substrates for temporarily capturing the enzyme on a resin functionalized with the carbamate probe and releasing the enzyme in active form after removal of the contaminating proteins. The isolation relied on the possibility of manipulating the carbamylation and decarbamylation kinetics favoring the former during the capture and wash steps and the latter in the release step. The designed probe captured and released all the active hBChE isoenzymes present in plasma with high selectivity (up to ∼2000-fold purification) and reasonable yields (17% to 36%). The parameters affecting the performance were the incubation time used in the load and elution steps, the plasma to resin volumetric ratio, the elution temperature and the nature and concentration of the eluting agent. The carbamate resin could be prepared either by coupling a fully synthesized probe with an activated resin or by building the probe onto the resin by a step-by-step procedure, without major differences in performance between the two routes. The prepared resins allowed to process up to about 8.5 mL of plasma per g of resin with constant performance. Since the method was based on the general catalytic cycle of mSHs, we expect this approach to be applicable to other enzymes of the family, by selecting a suitable target-selective feature to link to the carbamate group.
This journal is © The Royal Society of Chemistry.
Conflict of interest statement
There are no conflicts to declare.
Figures


Similar articles
-
A new method to characterize the kinetics of cholinesterases inhibited by carbamates.J Pharm Biomed Anal. 2017 Sep 10;144:175-182. doi: 10.1016/j.jpba.2017.04.007. Epub 2017 Apr 10. J Pharm Biomed Anal. 2017. PMID: 28483282
-
Small-scale purification of butyrylcholinesterase from human plasma and implementation of a μLC-UV/ESI MS/MS method to detect its organophosphorus adducts.Drug Test Anal. 2015 Oct;7(10):947-56. doi: 10.1002/dta.1792. Epub 2015 Mar 31. Drug Test Anal. 2015. PMID: 25828536
-
Molecular recognition by cholesterol esterase of active site ligands: structure-reactivity effects for inhibition by aryl carbamates and subsequent carbamylenzyme turnover.Biochemistry. 1996 Dec 24;35(51):16723-34. doi: 10.1021/bi961677v. Biochemistry. 1996. PMID: 8988009
-
Discovery of Highly Selective and Nanomolar Carbamate-Based Butyrylcholinesterase Inhibitors by Rational Investigation into Their Inhibition Mode.J Med Chem. 2016 Mar 10;59(5):2067-82. doi: 10.1021/acs.jmedchem.5b01674. Epub 2016 Feb 17. J Med Chem. 2016. PMID: 26886849
-
Optimization and characterization of a carbamate inhibitor for plasma platelet-activating factor acetylhydrolase (pPAFAH).2011 Nov 30 [updated 2014 May 13]. In: Probe Reports from the NIH Molecular Libraries Program [Internet]. Bethesda (MD): National Center for Biotechnology Information (US); 2010–. 2011 Nov 30 [updated 2014 May 13]. In: Probe Reports from the NIH Molecular Libraries Program [Internet]. Bethesda (MD): National Center for Biotechnology Information (US); 2010–. PMID: 23658952 Free Books & Documents. Review.
References
LinkOut - more resources
Full Text Sources

