

Highly efficient pollutant removal of graphitic carbon nitride by the synergistic effect of adsorption and photocatalytic degradation
- PMID: 35540325
- PMCID: PMC9078411
- DOI: 10.1039/c7ra11467b
Highly efficient pollutant removal of graphitic carbon nitride by the synergistic effect of adsorption and photocatalytic degradation
Abstract
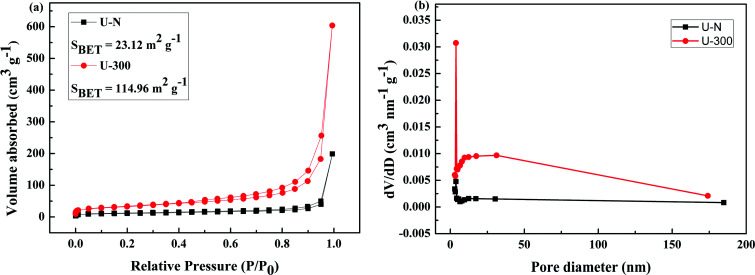
Environmental remediation based on semiconducting materials offers a green solution for pollution control in water. Herein, we report a novel graphitic carbon nitride (g-C3N4) by one-step polycondensation of urea. The novel g-C3N4 material with a surface area of 114 m2 g-1 allowed the repetitive adsorption of the rhodamine B (RhB) dye and facilitated its complete photocatalytic degradation upon light irradiation in 20 min. This study provides new insights into the fabrication of g-C3N4-based materials and facilitates their potential application in the synergistic removal of harmful organic pollutants in the field of water purification.
This journal is © The Royal Society of Chemistry.
Conflict of interest statement
There are no conflicts to declare.
Figures


Similar articles
-
Single-Step Synthesis of Graphitic Carbon Nitride Nanomaterials by Directly Calcining the Mixture of Urea and Thiourea: Application for Rhodamine B (RhB) Dye Degradation.Nanomaterials (Basel). 2023 Feb 17;13(4):762. doi: 10.3390/nano13040762. Nanomaterials (Basel). 2023. PMID: 36839130 Free PMC article.
-
Synthesis of polymeric 2D-graphitic carbon nitride (g-C3N4) nanosheets for sustainable photodegradation of organic pollutants.Heliyon. 2024 Jun 25;10(13):e33354. doi: 10.1016/j.heliyon.2024.e33354. eCollection 2024 Jul 15. Heliyon. 2024. PMID: 39040285 Free PMC article.
-
The synergy of adsorption and photosensitization of platinum-doped graphitic carbon nitride for improved removal of rhodamine B.Environ Sci Pollut Res Int. 2022 Mar;29(11):16449-16459. doi: 10.1007/s11356-021-15340-0. Epub 2021 Oct 14. Environ Sci Pollut Res Int. 2022. PMID: 34651272
-
Graphitic Carbon Nitride as a New Sustainable Photocatalyst for Textile Functionalization.Polymers (Basel). 2021 Jul 31;13(15):2568. doi: 10.3390/polym13152568. Polymers (Basel). 2021. PMID: 34372171 Free PMC article. Review.
-
Recent advances and perspectives of g-C3N4-based materials for photocatalytic dyes degradation.Chemosphere. 2022 May;295:133834. doi: 10.1016/j.chemosphere.2022.133834. Epub 2022 Feb 3. Chemosphere. 2022. PMID: 35124079 Review.
Cited by
-
Cobalt-Loaded Carbon Nitride Demonstrates Enhanced Photocatalytic Production of H2 from Lignocellulosic Biomass Components.Artif Photosynth. 2024 Sep 2;1(1):50-62. doi: 10.1021/aps.4c00007. eCollection 2025 Jan 23. Artif Photosynth. 2024. PMID: 40200991 Free PMC article.
-
Galvanic Replacement-Enabled Synthesis of In(OH)3/Ag/C Nanocomposite as an Effective Photocatalyst for Ultraviolet C Degradation of Methylene Blue.ACS Omega. 2020 Jun 4;5(23):13719-13728. doi: 10.1021/acsomega.0c00881. eCollection 2020 Jun 16. ACS Omega. 2020. PMID: 32566837 Free PMC article.
-
One-step, high-yield synthesis of g-C3N4 nanosheets for enhanced visible light photocatalytic activity.RSC Adv. 2019 Nov 29;9(67):39304-39314. doi: 10.1039/c9ra08922e. eCollection 2019 Nov 27. RSC Adv. 2019. PMID: 35540641 Free PMC article.
References
-
- Malato S. Fernández-Ibáñez P. Maldonado M. I. Blanco J. Gernjak W. Catal. Today. 2009;147:1–59. doi: 10.1016/j.cattod.2009.06.018. - DOI
-
- Meckenstock R. U. Elsner M. Griebler C. Lueders T. Stumpp C. Aamand J. Agathos S. N. Albrechtsen H. J. Bastiaens L. Bjerg P. L. Boon N. Dejonghe W. Huang W. E. Schmidt S. I. Smolders E. Sorensen S. R. Springael D. van Breukelen B. M. Environ. Sci. Technol. 2015;49:7073–7081. doi: 10.1021/acs.est.5b00715. - DOI - PubMed
LinkOut - more resources
Full Text Sources