

On the role of peptide hydrolysis for fibrillation kinetics and amyloid fibril morphology
- PMID: 35540346
- PMCID: PMC9078321
- DOI: 10.1039/c7ra10981d
On the role of peptide hydrolysis for fibrillation kinetics and amyloid fibril morphology
Abstract
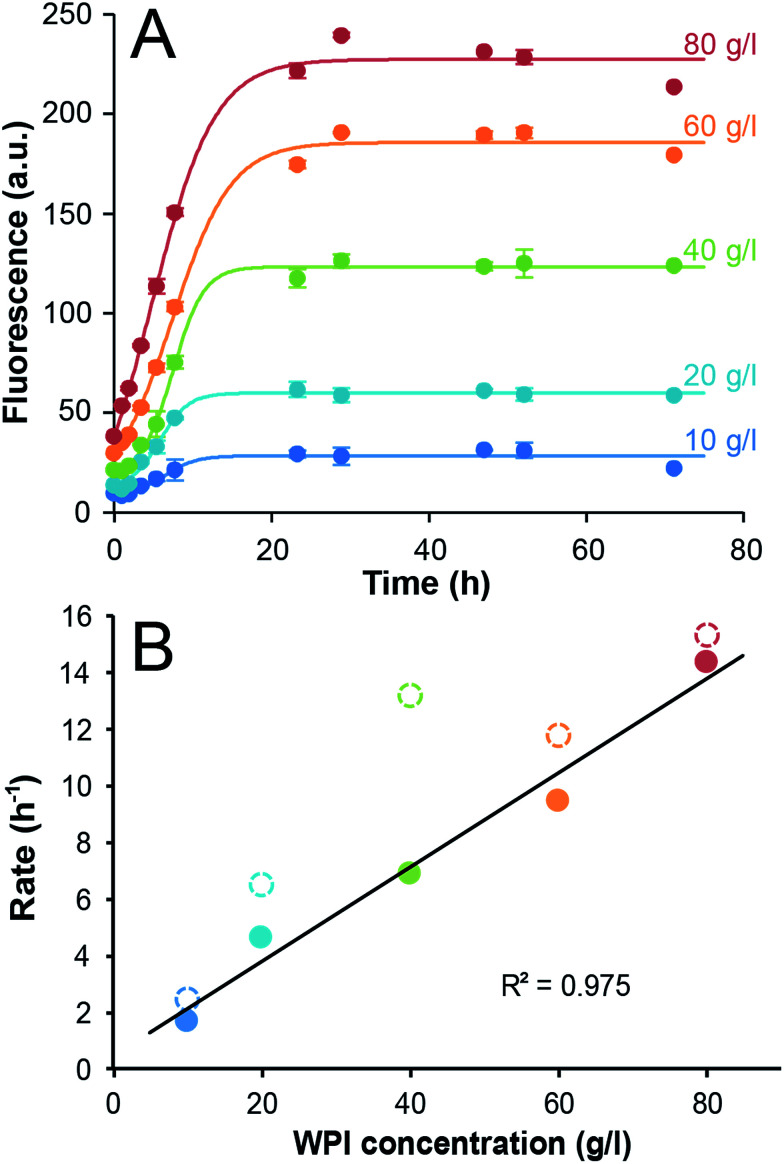
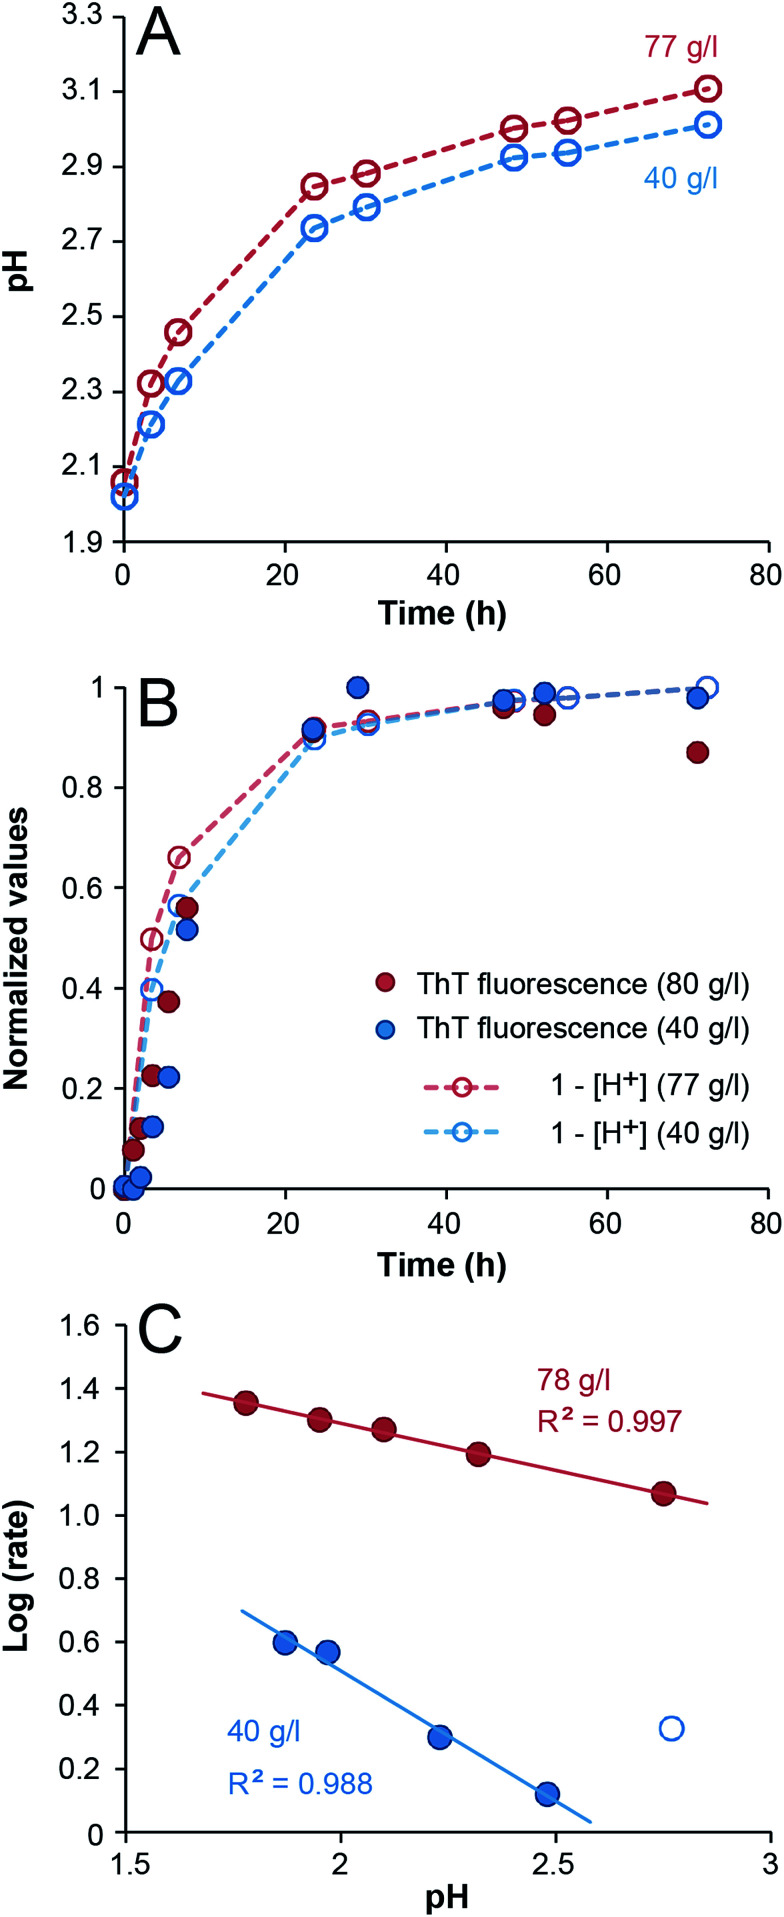
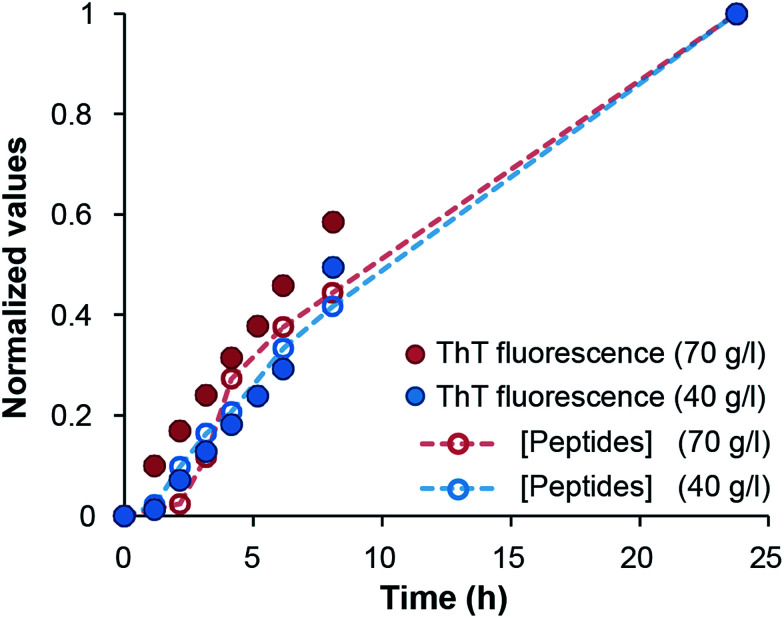
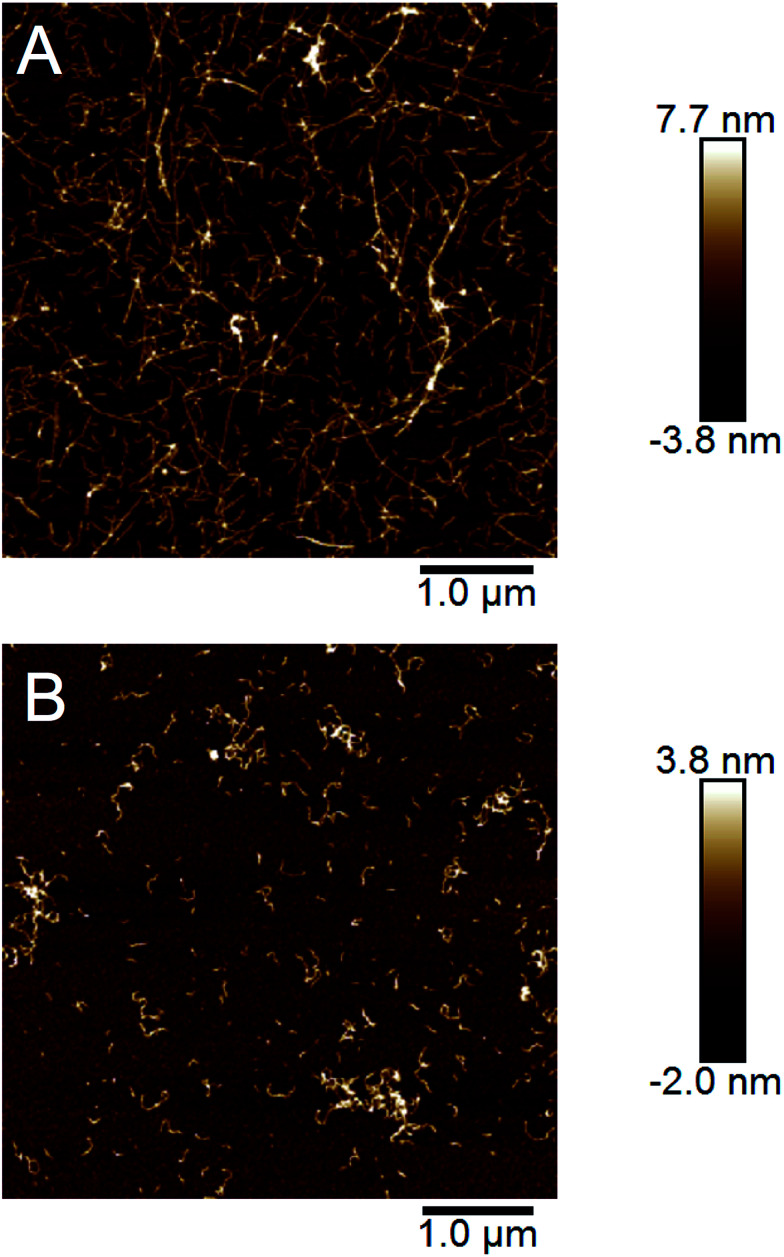
Self-assembly of proteins into amyloid-like nanofibrils is not only a key event in several diseases, but such fibrils are also associated with intriguing biological function and constitute promising components for new biobased materials. The bovine whey protein β-lactoglobulin has emerged as an important model protein for the development of such materials. We here report that peptide hydrolysis is the rate-determining step for fibrillation of β-lactoglobulin in whey protein isolate. We also explore the observation that β-lactoglobulin nanofibrils of distinct morphologies are obtained by simply changing the initial protein concentration. We find that the morphological switch is related to different nucleation mechanisms and that the two classes of nanofibrils are associated with variations of the peptide building blocks. Based on the results, we propose that the balance between protein concentration and the hydrolysis rate determines the structure of the formed nanofibrils.
This journal is © The Royal Society of Chemistry.
Conflict of interest statement
There are no conflicts to declare.
Figures
Similar articles
-
Structural characterisation of amyloid-like fibrils formed by an amyloidogenic peptide segment of β-lactoglobulin.RSC Adv. 2021 Aug 17;11(45):27868-27879. doi: 10.1039/d1ra03575d. eCollection 2021 Aug 16. RSC Adv. 2021. PMID: 35480736 Free PMC article.
-
Formation of β-lactoglobulin nanofibrils by microwave heating gives a peptide composition different from conventional heating.Biomacromolecules. 2012 Sep 10;13(9):2868-80. doi: 10.1021/bm300896r. Epub 2012 Aug 24. Biomacromolecules. 2012. PMID: 22877308
-
Macromolecular crowding modulates the kinetics and morphology of amyloid self-assembly by β-lactoglobulin.Int J Biol Macromol. 2013 Feb;53:82-7. doi: 10.1016/j.ijbiomac.2012.11.008. Epub 2012 Nov 10. Int J Biol Macromol. 2013. PMID: 23148946
-
The Kinetics, Thermodynamics and Mechanisms of Short Aromatic Peptide Self-Assembly.Adv Exp Med Biol. 2019;1174:61-112. doi: 10.1007/978-981-13-9791-2_3. Adv Exp Med Biol. 2019. PMID: 31713197 Review.
-
Understanding amyloid fibril nucleation and aβ oligomer/drug interactions from computer simulations.Acc Chem Res. 2014 Feb 18;47(2):603-11. doi: 10.1021/ar4002075. Epub 2013 Dec 24. Acc Chem Res. 2014. PMID: 24368046 Review.
Cited by
-
Formation and Physicochemical Properties of Freeze-Dried Amyloid-Like Fibrils From Pinto Bean Protein: Amyloid-Like Fibrils From Pinto Bean Protein.Int J Anal Chem. 2024 Oct 23;2024:5571705. doi: 10.1155/2024/5571705. eCollection 2024. Int J Anal Chem. 2024. PMID: 39479388 Free PMC article.
-
Structural characterisation of amyloid-like fibrils formed by an amyloidogenic peptide segment of β-lactoglobulin.RSC Adv. 2021 Aug 17;11(45):27868-27879. doi: 10.1039/d1ra03575d. eCollection 2021 Aug 16. RSC Adv. 2021. PMID: 35480736 Free PMC article.
-
From Fundamental Amyloid Protein Self-Assembly to Development of Bioplastics.Biomacromolecules. 2024 Jan 8;25(1):5-23. doi: 10.1021/acs.biomac.3c01129. Epub 2023 Dec 26. Biomacromolecules. 2024. PMID: 38147506 Free PMC article. Review.
-
A new fibrillization mechanism of β-lactoglobulin in glycine solutions.Int J Biol Macromol. 2022 Sep 1;216:414-425. doi: 10.1016/j.ijbiomac.2022.06.182. Epub 2022 Jul 6. Int J Biol Macromol. 2022. PMID: 35803407 Free PMC article.
-
Self-assembly of plant protein fibrils interacting with superparamagnetic iron oxide nanoparticles.Sci Rep. 2019 Jun 20;9(1):8939. doi: 10.1038/s41598-019-45437-z. Sci Rep. 2019. PMID: 31222107 Free PMC article.
References
LinkOut - more resources
Full Text Sources