

A structural dissection of protein-RNA interactions based on different RNA base areas of interfaces
- PMID: 35540439
- PMCID: PMC9078961
- DOI: 10.1039/c8ra00598b
A structural dissection of protein-RNA interactions based on different RNA base areas of interfaces
Abstract
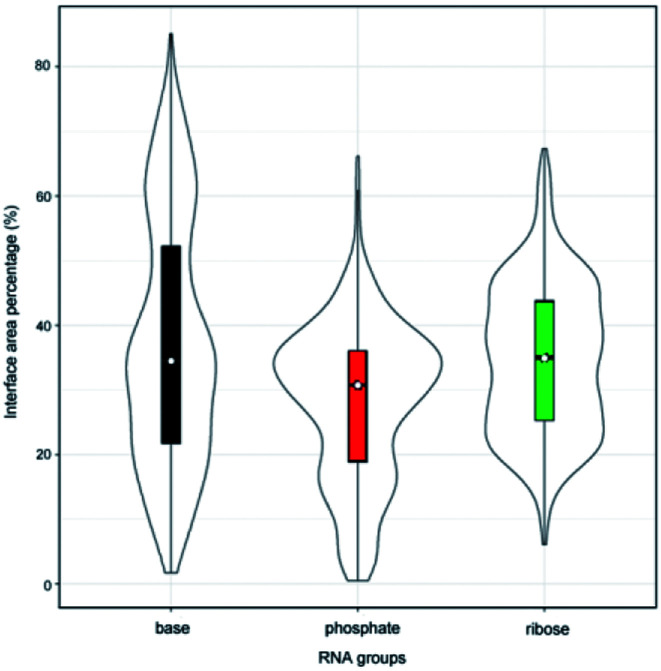
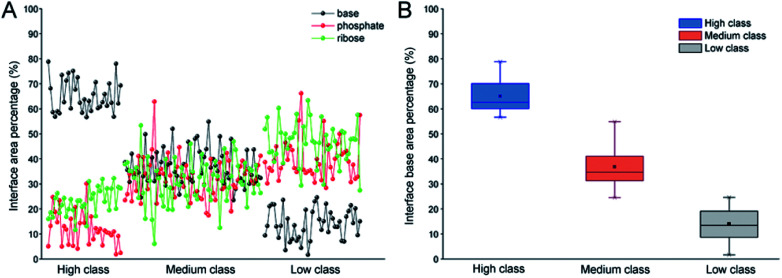
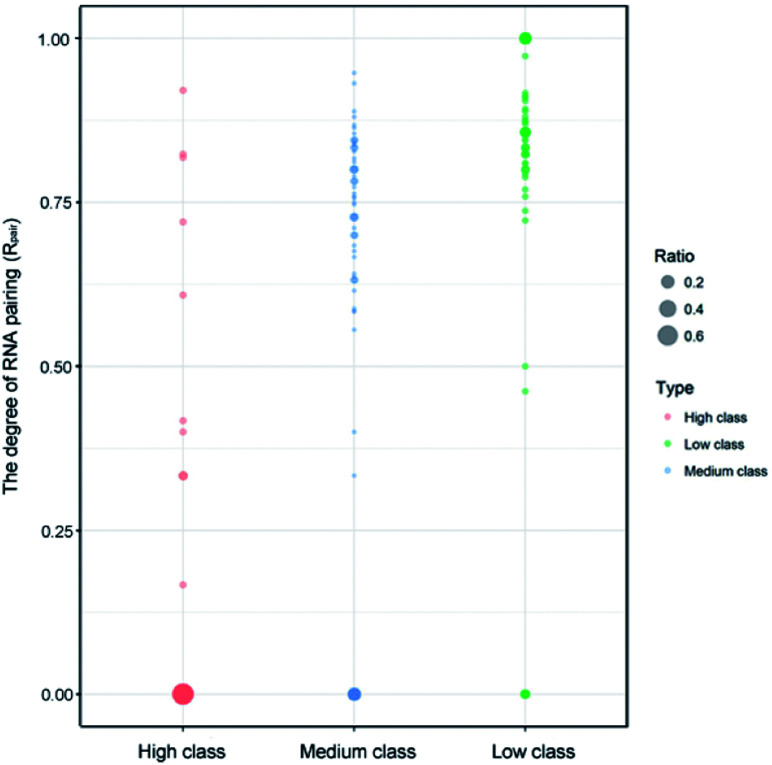
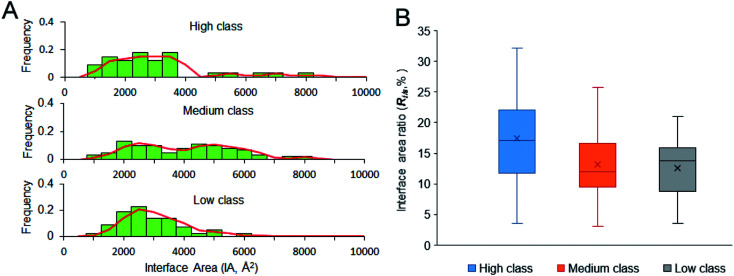
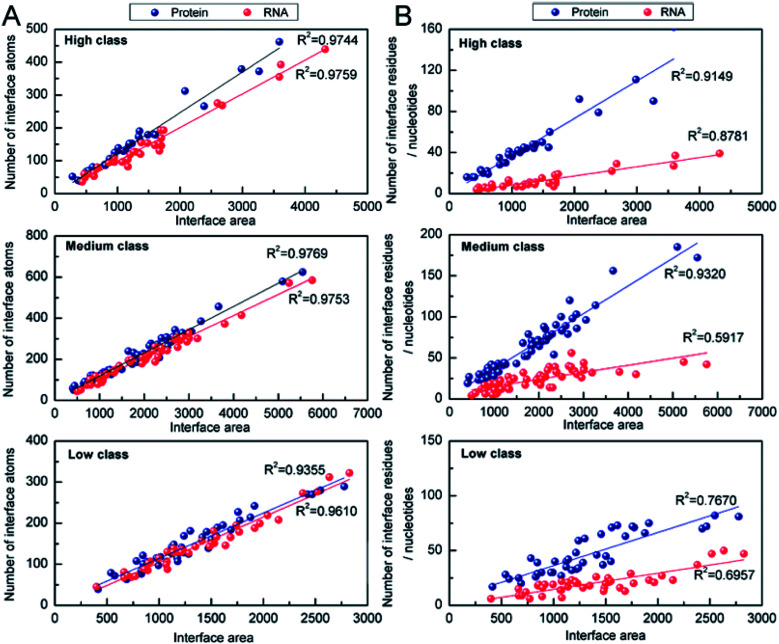
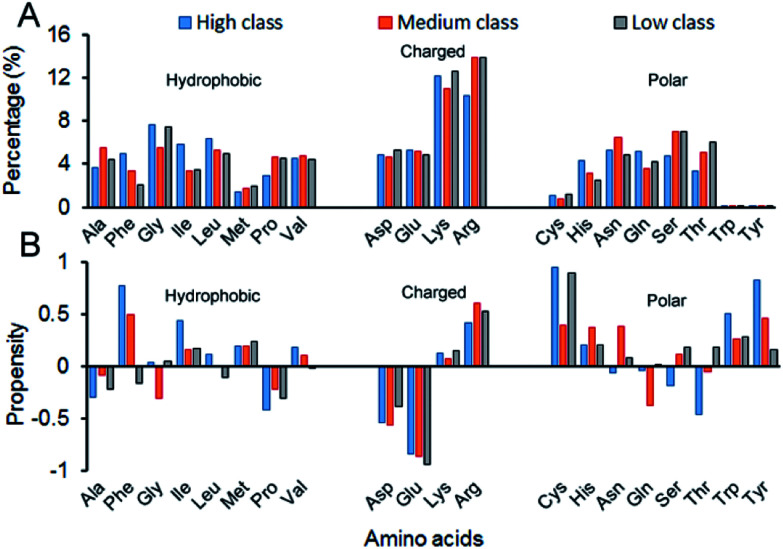
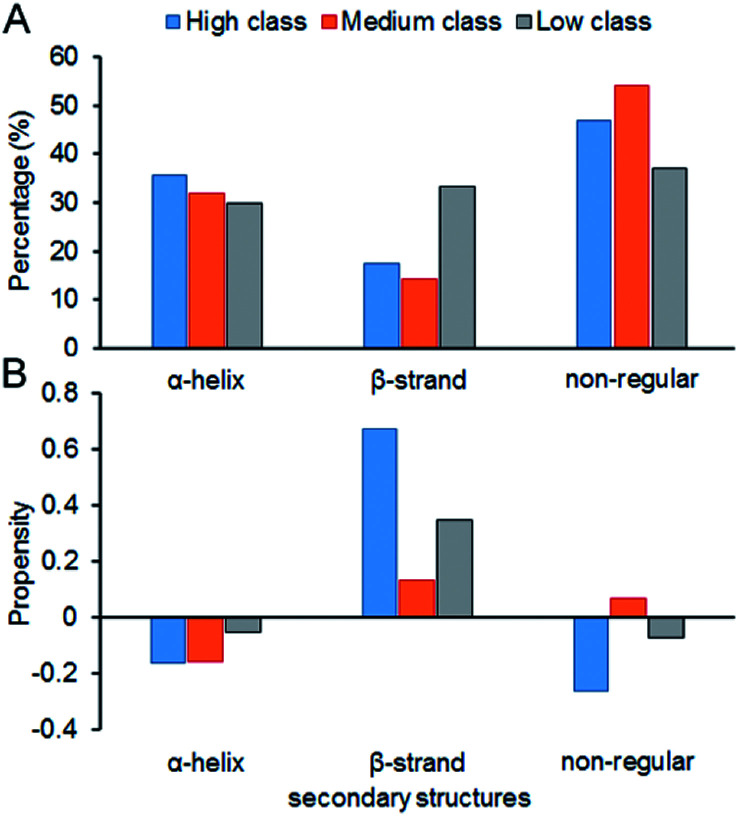
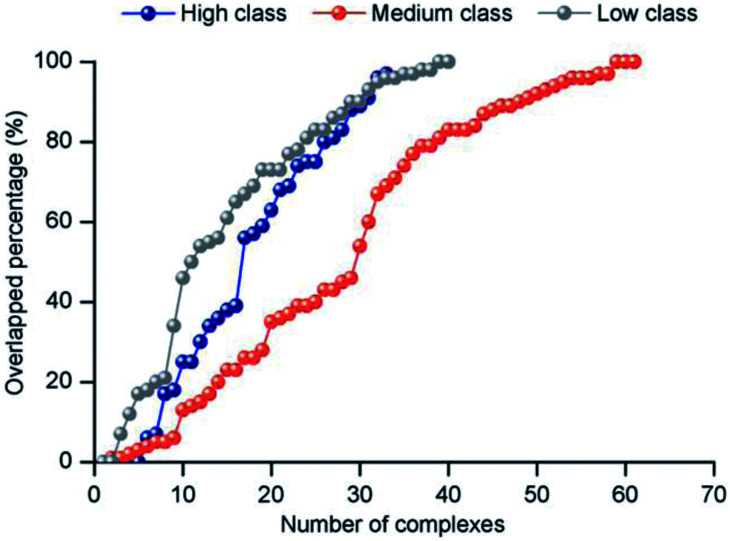
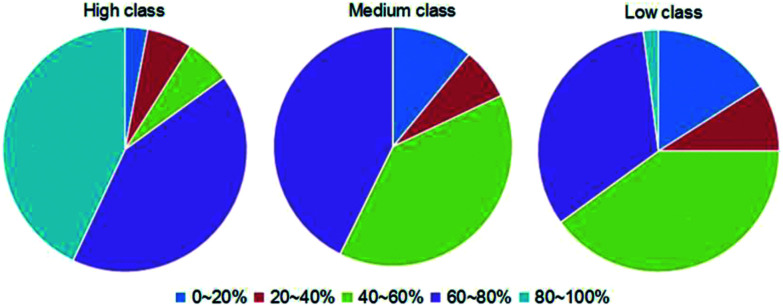
Protein-RNA interactions are very common cellular processes, but the mechanisms of interactions are not fully understood, mainly due to the complicated RNA structures. By the elaborate investigation on RNA structures of protein-RNA complexes, it was firstly found in this paper that RNAs in these complexes could be clearly classified into three classes (high, medium and low) based on the different levels of P base (the percentage of base area buried in the RNA interface). In view of the three RNA classes, more detailed analyses on protein-RNA interactions were comprehensively performed from various aspects, including interface area, structure, composition and interaction force, so as to achieve a deeper understanding of the recognition specificity for the three classes of protein-RNA interactions. According to our classification strategy, the three complex classes have significant differences in terms of almost all properties. Complexes in the high class have short and extended RNA structures and behave like protein-ssDNA interactions. Their hydrogen bonds and hydrophobic interactions are strong. For complexes in low class, their RNA structures are mainly double-stranded, like protein-dsDNA interactions, and electrostatic interactions frequently occur. The complexes in medium class have the longest RNA chains and largest average interface area. Meanwhile, they do not show any preference for the interaction force. On average, in terms of composition, secondary structures and intermolecular physicochemical properties, significant feature preferences can be observed in high and low complexes, but no highly specific features are found for medium complexes. We found that our proposed P base is an important parameter which can be used as a new determinant to distinguish protein-RNA complexes. For high and low complexes, we can more easily understand the specificity of the recognition process from the interface features than for medium complexes. In the future, medium complexes should be our research focus to further structurally analyze from more feature aspects. Overall, this study may contribute to further understanding of the mechanism of protein-RNA interactions on a more detailed level.
This journal is © The Royal Society of Chemistry.
Conflict of interest statement
There are no conflicts to declare.
Figures
Similar articles
-
Protein-protein interfaces are vdW dominant with selective H-bonds and (or) electrostatics towards broad functional specificity.Bioinformation. 2017 Jun 30;13(6):164-173. doi: 10.6026/97320630013164. eCollection 2017. Bioinformation. 2017. PMID: 28729757 Free PMC article.
-
Molecular architecture of protein-RNA recognition sites.J Biomol Struct Dyn. 2015;33(12):2738-51. doi: 10.1080/07391102.2015.1004652. Epub 2015 Feb 11. J Biomol Struct Dyn. 2015. PMID: 25562181
-
Dissecting the protein-RNA interface: the role of protein surface shapes and RNA secondary structures in protein-RNA recognition.Nucleic Acids Res. 2012 Apr;40(8):3299-306. doi: 10.1093/nar/gkr1225. Epub 2011 Dec 22. Nucleic Acids Res. 2012. PMID: 22199255 Free PMC article.
-
Recognition modes of RNA tetraloops and tetraloop-like motifs by RNA-binding proteins.Wiley Interdiscip Rev RNA. 2014 Jan-Feb;5(1):49-67. doi: 10.1002/wrna.1196. Epub 2013 Oct 3. Wiley Interdiscip Rev RNA. 2014. PMID: 24124096 Free PMC article. Review.
-
Cooperativity and Interdependency between RNA Structure and RNA-RNA Interactions.Noncoding RNA. 2021 Dec 15;7(4):81. doi: 10.3390/ncrna7040081. Noncoding RNA. 2021. PMID: 34940761 Free PMC article. Review.
Cited by
-
LncRNA LITATS1 suppresses TGF-β-induced EMT and cancer cell plasticity by potentiating TβRI degradation.EMBO J. 2023 May 15;42(10):e112806. doi: 10.15252/embj.2022112806. Epub 2023 Mar 30. EMBO J. 2023. PMID: 36994542 Free PMC article.
-
RNA Binding Mechanism of the FUS Zinc Finger in Concert with Its Flanking Intrinsically Disordered Region.J Chem Inf Model. 2025 Aug 11;65(15):8262-8275. doi: 10.1021/acs.jcim.5c01059. Epub 2025 Jul 22. J Chem Inf Model. 2025. PMID: 40693919 Free PMC article.
-
Footprinting SHAPE-eCLIP Reveals Transcriptome-wide Hydrogen Bonds at RNA-Protein Interfaces.Mol Cell. 2020 Dec 3;80(5):903-914.e8. doi: 10.1016/j.molcel.2020.11.014. Epub 2020 Nov 25. Mol Cell. 2020. PMID: 33242392 Free PMC article.
-
RNA-dependent proteome solubility maintenance in Escherichia coli lysates analysed by quantitative mass spectrometry: Proteomic characterization in terms of isoelectric point, structural disorder, functional hub, and chaperone network.RNA Biol. 2024 Jan;21(1):1-18. doi: 10.1080/15476286.2024.2315383. Epub 2024 Feb 15. RNA Biol. 2024. PMID: 38361426 Free PMC article.
-
Identification of a SNAI1 enhancer RNA that drives cancer cell plasticity.Nat Commun. 2025 Mar 25;16(1):2890. doi: 10.1038/s41467-025-58032-w. Nat Commun. 2025. PMID: 40133308 Free PMC article.
References
-
- Re A. Joshi T. Kulberkyte E. Morris Q. Workman C. T. Methods Mol. Biol. 2014;1097:491–521. - PubMed
LinkOut - more resources
Full Text Sources
Other Literature Sources