. 2019 Nov 6;9(62):36162-36170.
doi: 10.1039/c9ra07634d. eCollection 2019 Nov 4.

Plasma fatty acid metabolic profiling coupled with clinical research reveals the risk factors for atherosclerosis development in type 2 diabetes mellitus

Affiliations

Plasma fatty acid metabolic profiling coupled with clinical research reveals the risk factors for atherosclerosis development in type 2 diabetes mellitus

Qianyu Zhou et al. RSC Adv. .

Abstract

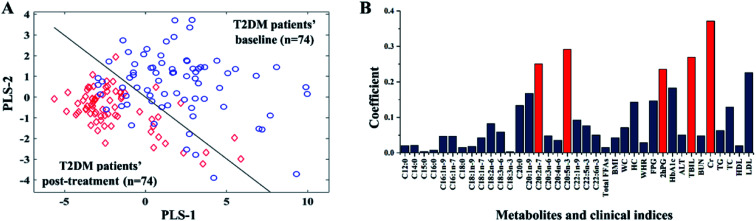
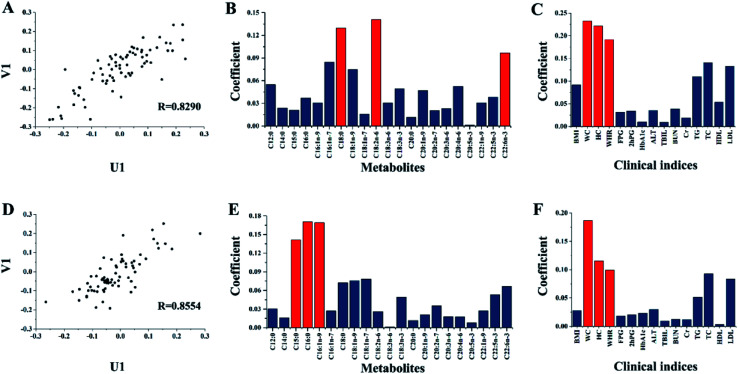
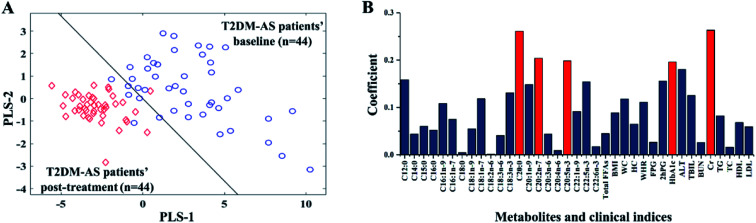
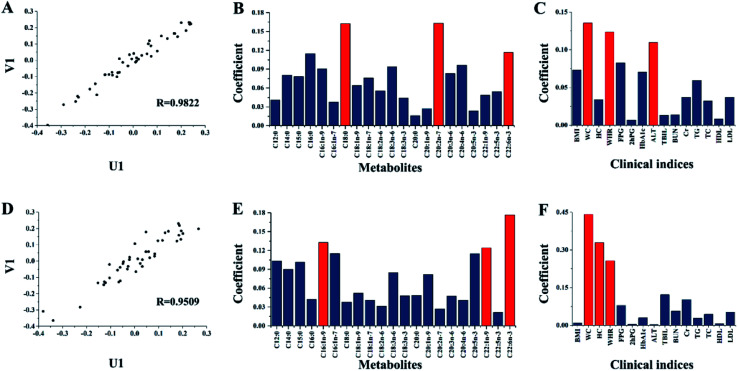
Many publications have reported that the incidence of atherosclerotic cardiovascular diseases is higher in patients with type 2 diabetes mellitus (T2DM) than in the non-diabetic population; however, until now, the reason has been unclear. In this study, 25 males (25/64, 39.06%) and 19 females (19/54, 35.19%) had complications with atherosclerosis after two years. To reveal the risk factors for developing atherosclerosis in patients with T2DM, plasma fatty acid metabolic profiling based on gas chromatography-mass spectrometry was combined with the analysis of clinical biochemical indices. The results of partial least squares-discriminant and canonical correlation analyses suggested that C20:0, C22:6n-3, glycosylated hemoglobin, waist circumference, and waist-to-hip ratio are likely to be closely related to T2DM complicated with atherosclerosis. Metabolomic information is a beneficial supplement to existing clinical indices and is useful in predicting the development of a patient's disease and optimizing the treatment.


Conflict of interest statement

The authors declare no competing financial interests.

Figures

Fig. 1
Fig. 1. 2D-project plots obtained by PLS-DA for the 74 T2DM patients without AS before and after treatment (A) and the absolute value of coefficient β of each variable for discrimination (B). Each projection point in (A) indicates either a baseline (blue) or a post-treatment (red) sample. The AUC value was 96.05%. Correct rates of 10-fold cross-validation for baseline and post-treatment were 87.84% and 94.59%, respectively. Cr, TBIL, 2hPG, C20:2n-7, and C20:5n-3 were screened out as key indices.
Fig. 2
Fig. 2. The results of CCA for the 74 T2DM patients without AS. (A) and (D) show the correlation of the first pair of canonical variables of metabolites (U1) and clinical indices (V1) for the 74 T2DM patients before and after two years of treatment. (B) and (E) show the coefficients' absolute values of the first pair of canonical variables in fatty acids of the 74 T2DM patients before and after two years of treatment. (C) and (F) show the coefficients' absolute values for the first pair of canonical variables in the clinical indices of the 74 T2DM patients before and after two years of treatment. R is the correlation coefficient of the corresponding U1 and V1.
Fig. 3
Fig. 3. 2D-project plots obtained by PLS-DA for the 44 T2DM-AS patients before and after treatment (A) and the absolute value of coefficient β for each variable for the discrimination (B). Each projection point in (A) indicated either a baseline (blue) or a post-treatment (red) sample. The AUC value was 97.49%. The correct rates of 10-fold cross-validation for baseline and post-treatment were 90.91% and 100%, respectively. Cr, HbA1c, C20:2n-7, C20:5n-3, and C20:0 were screened out as key indices.
Fig. 4
Fig. 4. The results of the canonical correlation analysis for the 44 T2DM-AS patients: (A) and (D) show the correlation of the first pair of canonical variables of metabolites (U1) and clinical indices (V1) for the 44 T2DM-AS patients before and after two years of treatment. (B) and (E) show the coefficients' absolute values of the first pair of canonical variables in fatty acids of the 44 T2DM-AS patients before and after two years of treatment. (C) and (F) showed the coefficients' absolute values of the first pair of canonical variables in the clinical indices of 44 T2DM-AS patients before and after two years of treatment. R was the correlation coefficient of corresponding U1 and V1.

Similar articles

Cited by

References

    1. Hocher B. Adamski J. Nat. Rev. Nephrol. 2017;13(5):269–284. doi: 10.1038/nrneph.2017.30. - DOI - PubMed
    1. Ravenzwaay B. V. Herold M. Kamp H. et al. . Mutat. Res. 2012;746(2):144–150. - PubMed
    1. Wu H. Wang W. Environ. Toxicol. Chem. 2015;30(4):806–812. doi: 10.1002/etc.446. - DOI - PubMed
    1. Würtz P. Wang Q. Soininen P. et al. . J. Am. Coll. Cardiol. 2016;67(10):1200–1210. doi: 10.1016/j.jacc.2015.12.060. - DOI - PMC - PubMed
    1. Chiba Y. Yamakawa T. Tsuchiya H. et al. . J. Clin. Med. Res. 2018;10(8):648–656. doi: 10.14740/jocmr3464w. - DOI - PMC - PubMed