. 2019 Nov 28;9(67):38998-39010.
doi: 10.1039/c9ra08569f. eCollection 2019 Nov 27.

Carbon nanotube reinforced polyvinyl alcohol/biphasic calcium phosphate scaffold for bone tissue engineering

Affiliations

Carbon nanotube reinforced polyvinyl alcohol/biphasic calcium phosphate scaffold for bone tissue engineering

Weiwei Lan et al. RSC Adv. .

Abstract

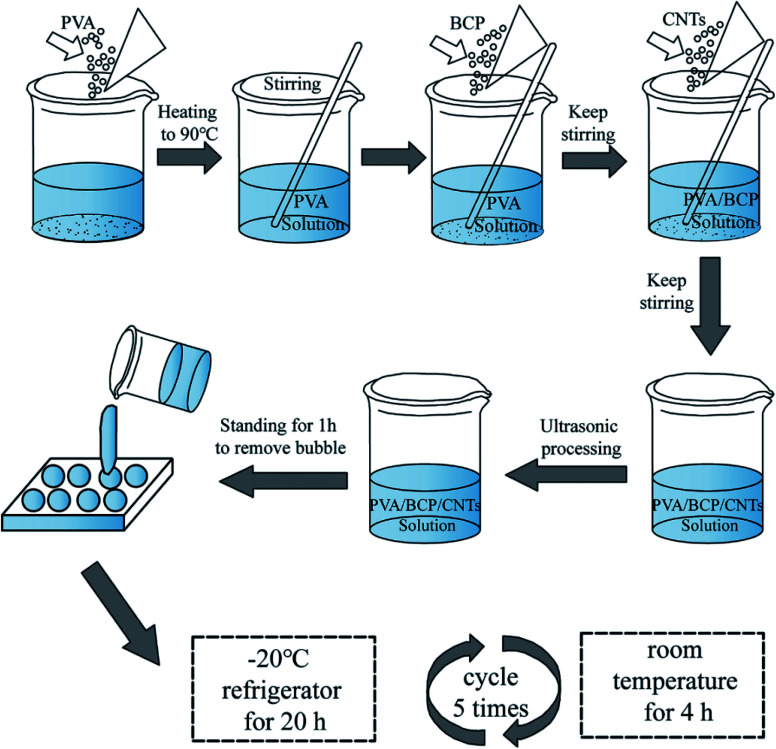
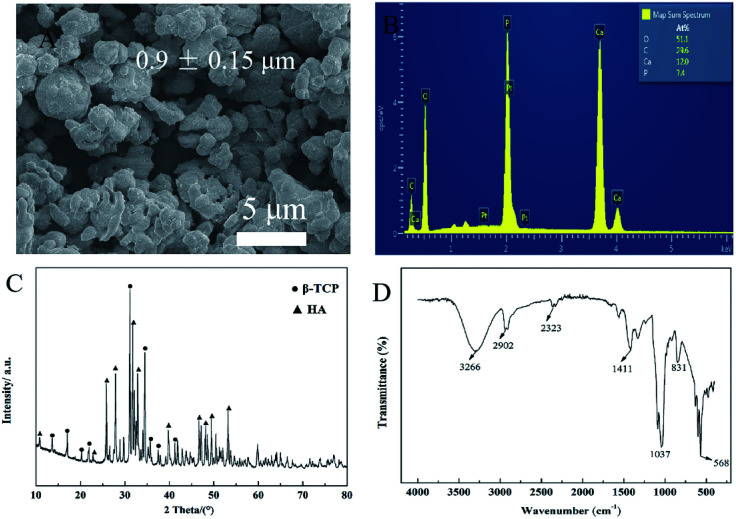
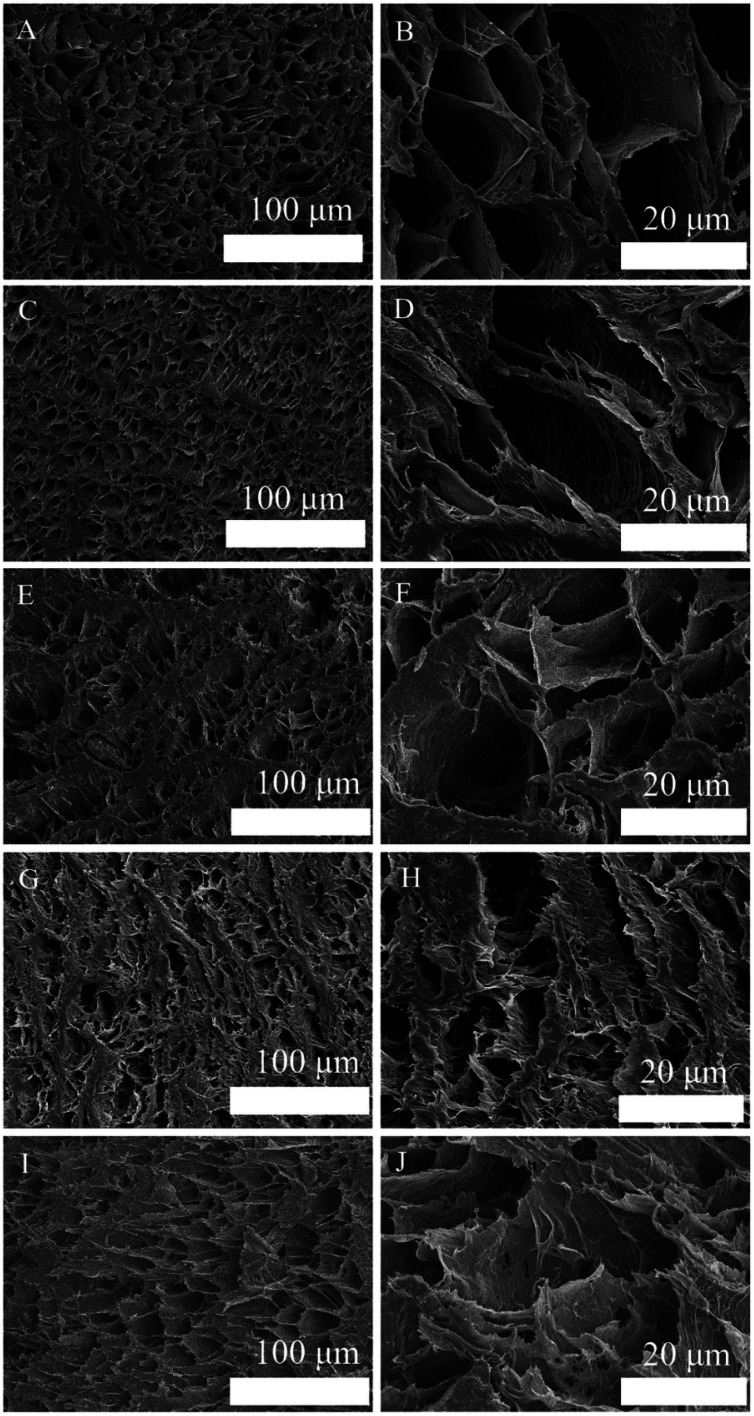
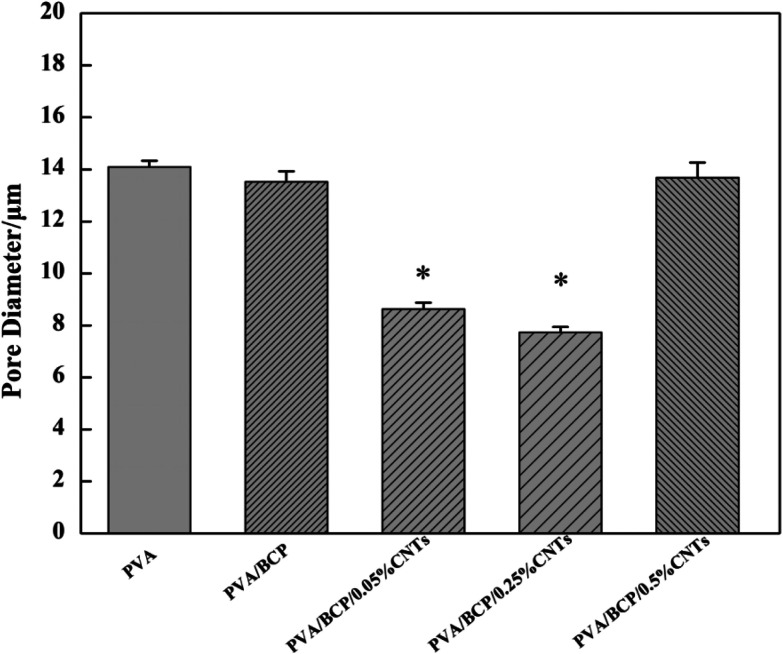
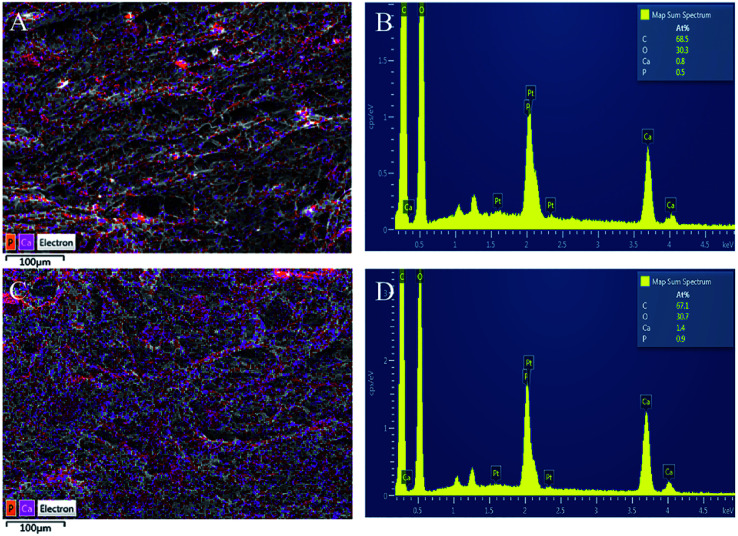
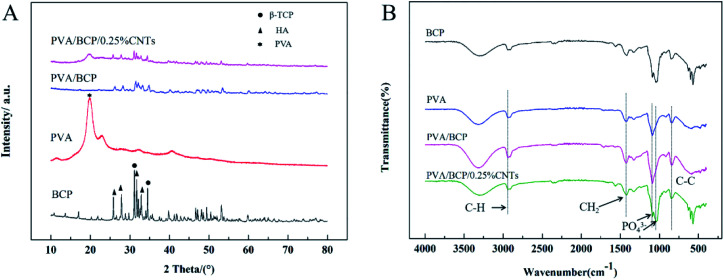
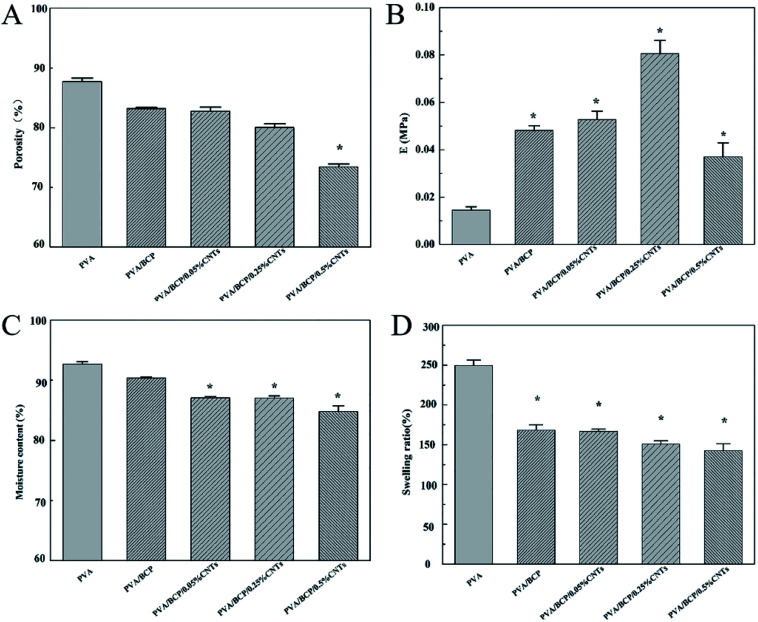
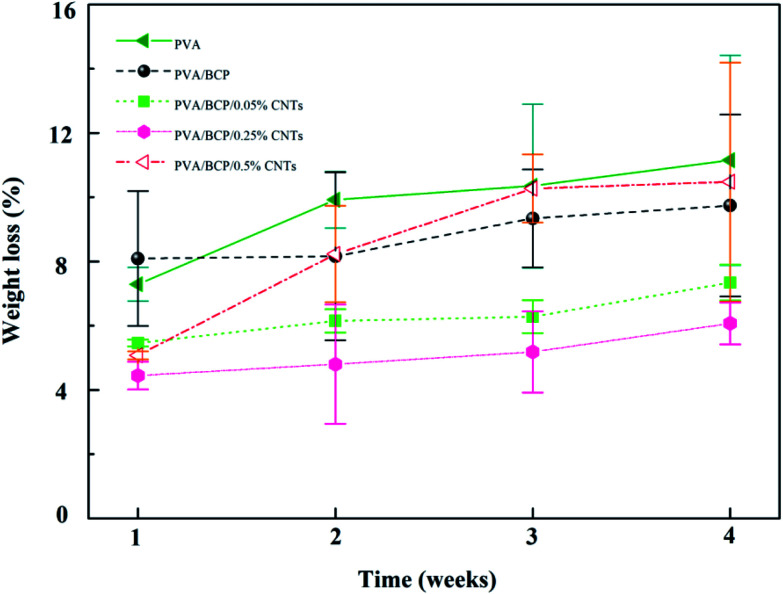
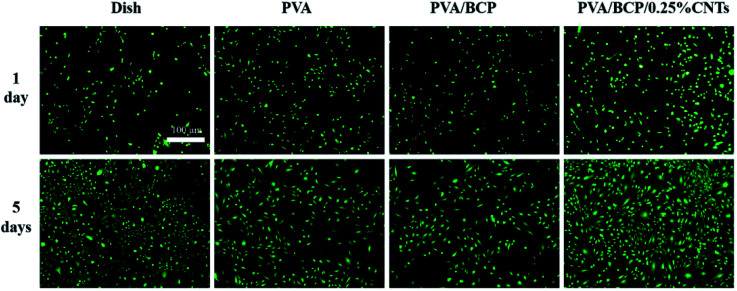
In this paper, a well-developed porous carbon nanotube (CNT) reinforced polyvinyl alcohol/biphasic calcium phosphate (PVA/BCP) scaffold was fabricated by a freeze-thawing and freeze-drying method. The microstructure, mechanical properties and the composition of the scaffolds were characterized by field emission scanning electron microscopy (FE-SEM), X-ray diffraction (XRD) and Fourier-transform infrared spectroscopy (FTIR). The results illustrate that after the incorporation of CNTs, the compressive strength of the hydrogels (moisture state) reached 81 ± 6 kPa, presenting a significantly higher value than that of pure PVA/BCP hydrogels (48 ± 2 kPa). Meanwhile, CNT reinforced PVA/BCP scaffolds exhibited a porous structure and high interconnectivity (80 ± 0.6%). The degradation analysis indicated that the degradation ratio of scaffolds can be varied by changing the concentrations of BCP powders and CNTs. Cell culture results show that PVA/BCP/CNT porous scaffolds have no negative effects on the survival and proliferation of cells. These results strongly show that the composite scaffolds may possess a potential application in the field of bone tissue engineering and regeneration.


Conflict of interest statement

There are no conflicts to declare.

Figures

Fig. 1
Fig. 1. Schematic illustration of the synthesis of hydrogels.
Fig. 2
Fig. 2. Physical characterization of BCP powders. (A) SEM micrograph of BCP powders. (B) EDS analysis of BCP powders. (C) XRD pattern of BCP powders. (D) FTIR spectrum of BCP powders.
Fig. 3
Fig. 3. SEM images of the morphologies and microstructures of the prepared porous scaffolds at different magnifications: (A and B) PVA scaffold, (C and D) PVA/BCP scaffold, (E and F) PVA/BCP/0.05% CNT scaffold, (G and H) PVA/BCP/0.25% CNTs and (I and J) PVA/BCP/0.5% CNTs.
Fig. 4
Fig. 4. The average pore size of scaffolds. Error bars represent the mean ± standard error (n ≥ 250), *P < 0.05 compared to PVA group.
Fig. 5
Fig. 5. EDS analysis of scaffolds. (A and B) EDS analysis of PVA/BCP scaffolds, (C and D) EDS analysis of PVA/BCP/0.25% CNT scaffolds.
Fig. 6
Fig. 6. XRD results and FTIR spectroscopy analyses of the samples. (A) XRD results, (B) FTIR spectroscopy analyses.
Fig. 7
Fig. 7. The porosity, elasticity modulus, moisture content and swelling ratio analyses of samples. (A) Porosity results, (B) elasticity modulus, (C) moisture content and (D) swelling ratio. Error bars represent the mean ± standard error. *P < 0.05 compared to PVA group.
Fig. 8
Fig. 8. The weight loss of the prepared scaffolds in the lysozyme solution after different soaking times. Error bars represent the mean ± standard error, n = 5.
Fig. 9
Fig. 9. The fluorescence images of FDA/PI stained cells cultured with scaffold extracts after culturing for 1 and 5 day(s). Scale bars: 100 μm.
Fig. 10
Fig. 10. Fluorescence images of FDA/PI staining of the scaffolds after cell culturing for 1, 3, 5 and 7 day(s). Scale bars: 100 μm.
Fig. 11
Fig. 11. The fluorescence images of FITC-DAPI stained cells cultured with scaffold extracts after culturing for 1 and 5 day(s). Scale bars: 20 μm.
Fig. 12
Fig. 12. CCK-8 results. A. CCK-8 results of cells cultured with scaffolds' extracts after culturing for 1, 3, 5 and 7 day(s). Error bars represent the mean ± standard error, *P < 0.05 compared to PVA group at the same time point. B. CCK-8 results after cells' culturing for 1, 3, 5 and 7 day(s) on different sample surfaces. Error bars represent the mean ± standard error, *P < 0.05 compared to PVA group at the same time point.
Fig. 13
Fig. 13. ALP activity of cells on scaffolds after 7 and 14 days after seeding. Error bars represent the mean ± standard error, *P < 0.05 compared to dish group at the same time point.
Fig. 14
Fig. 14. MC3T3-E1 cells' morphologies observed by SEM after 1 day on scaffolds. (A and D) culturing on PVA scaffolds, (B and E) culturing on PVA/BCP scaffolds, (C and F) culturing on PVA/BCP/0.25% CNT scaffolds.
Fig. 15
Fig. 15. Model of MC3T3-E1 cell culturing on different types of scaffolds.

Similar articles

Cited by

References

    1. Bai L. Du Z. Du J. Yao W. Zhang J. Weng Z. Liu S. Zhao Y. Liu Y. Zhang X. Huang X. Hang R. Huang D. Tang B. Xiao Y. Biomaterials. 2018;162:154–169. doi: 10.1016/j.biomaterials.2018.02.010. - DOI - PubMed
    1. Nie L. Chen D. Suo J. Zou P. Feng S. Yang Q. Yang S. Ye S. Colloids Surf., B. 2012;100:169–176. doi: 10.1016/j.colsurfb.2012.04.046. - DOI - PubMed
    1. Kurien T. Pearson R. Scammell B. Bone Joint. J. 2013;95:583–597. doi: 10.1302/0301-620X.95B5.30286. - DOI - PubMed
    1. Ji W. Zhang X. Qiu Y. World J. Exp. Med. 2016;6:58–62. doi: 10.5493/wjem.v6.i3.58. - DOI - PMC - PubMed
    1. Algul D. Gokce A. Onal A. Servet E. Ekici A. I. D. Yener F. J. Biomater. Sci., Polym. Ed. 2016;27:10. doi: 10.1080/09205063.2016.1140501. - DOI - PubMed