

Coherency image analysis to quantify collagen architecture: implications in scar assessment
- PMID: 35540841
- PMCID: PMC9078703
- DOI: 10.1039/c7ra12693j
Coherency image analysis to quantify collagen architecture: implications in scar assessment
Abstract
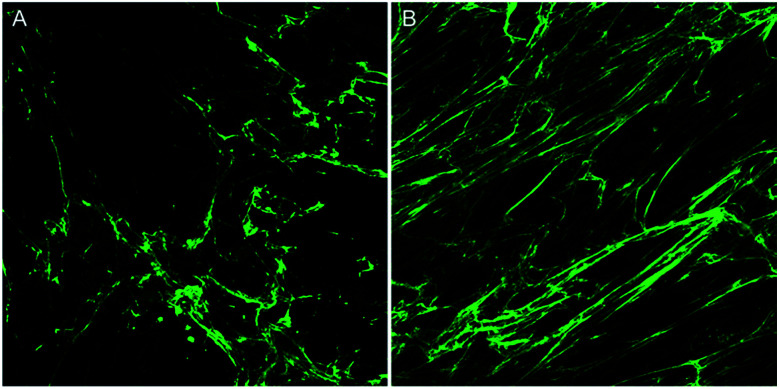
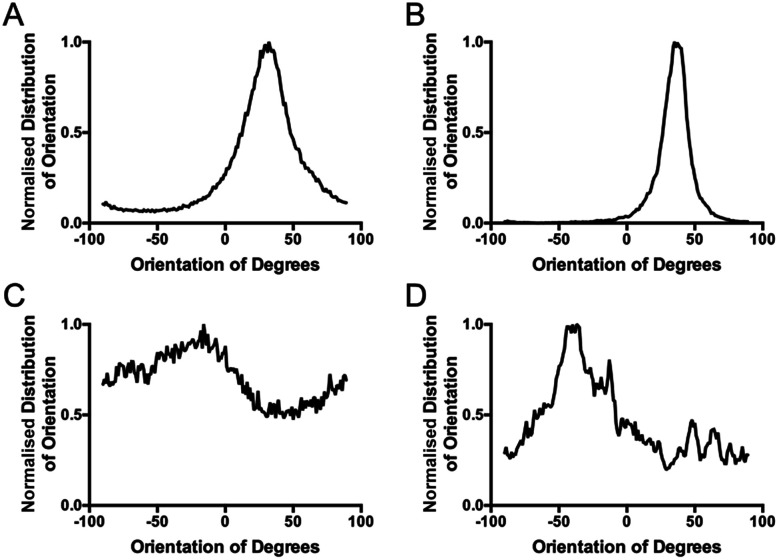
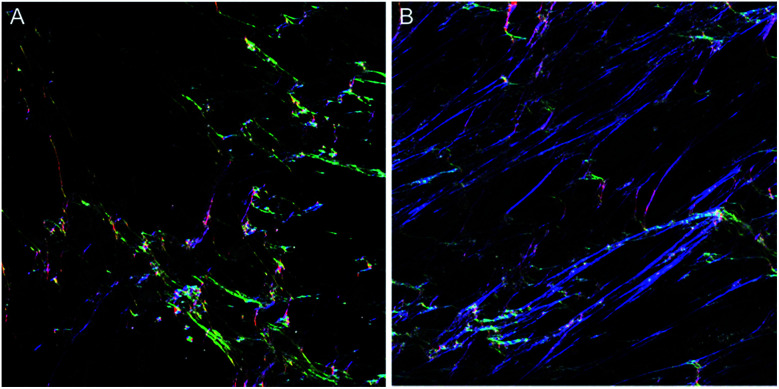
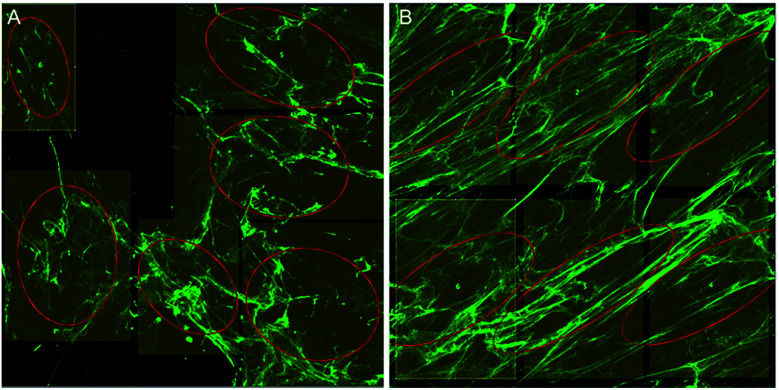
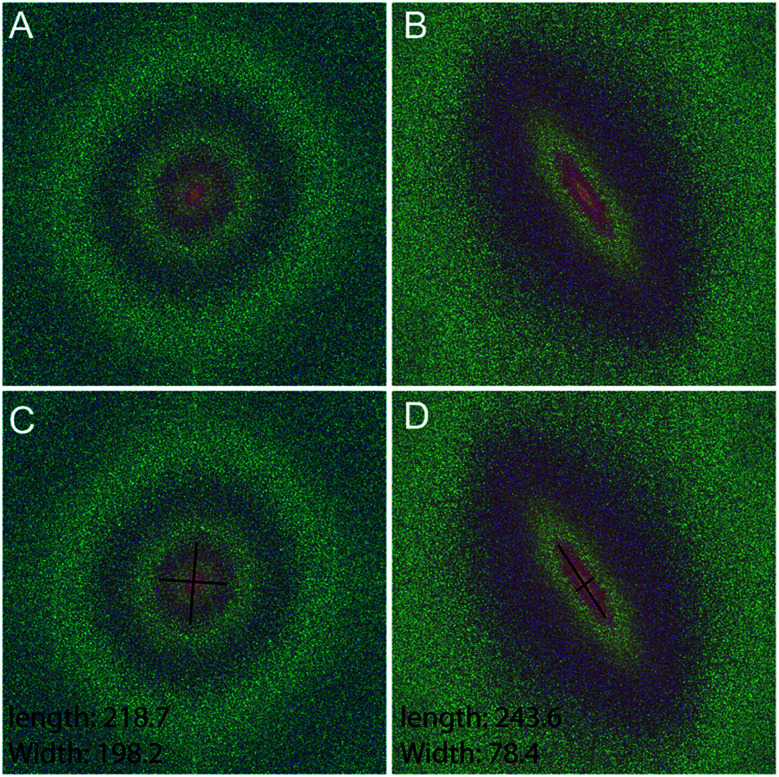
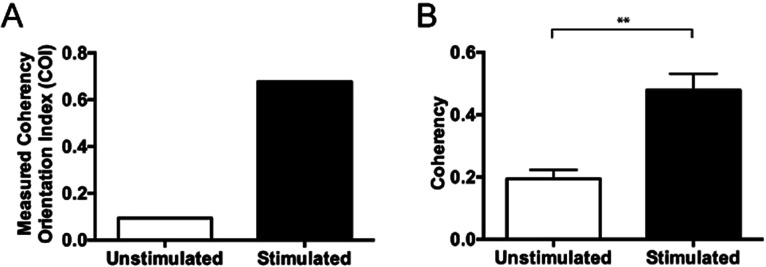
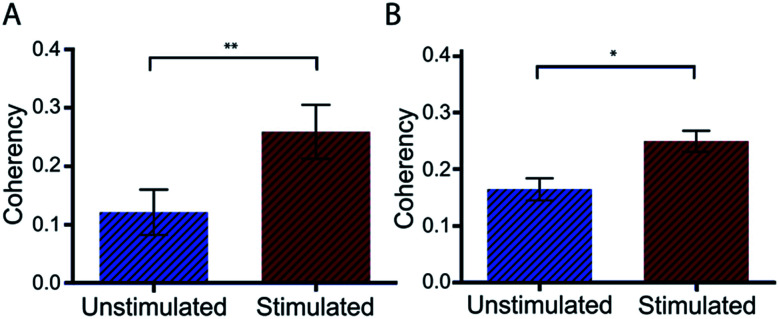
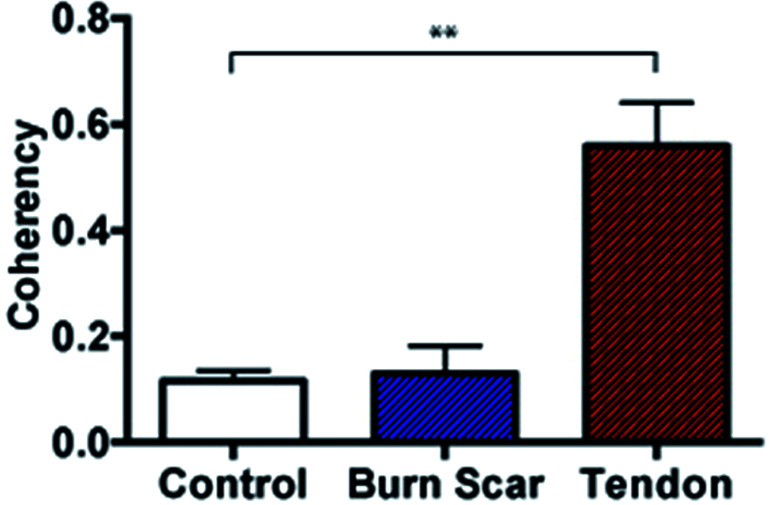
An important histological difference between normal, uninjured dermis and scar tissue such as that found in keloid scars is the pattern (morphological architecture) in which the collagen is deposited and arranged. In the uninjured dermis, collagen bundle architecture appears randomly organized (or in a basket weave formation), whereas in pathological conditions such as keloid scar tissue, collagen bundles are often found in whorls or in a hypotrophic scar collagen is more densely packed in a parallel configuration. In the case of skin, a scar disables the dermis, leaving it weaker, stiff and with a loss of optimal functionality. The absence of objective and quantifiable assessments of collagen orientation is a major bottleneck in monitoring progression of scar therapeutics. In this article, a novel quantitative approach for analyzing collagen orientation is reported. The methodology is demonstrated using collagen produced by cells in a model scar environment and examines collagen remodeling post-TGFβ stimulation in vitro. The method is shown to be reliable and effective in identifying significant coherency differences in the collagen deposited by human keloid scar cells. The technique is also compared for analysing collagen architecture in rat sections of normal, scarred skin and tendon tissue. Results demonstrate that the proposed computational method provides a fast and robust way of analyzing collagen orientation in a manner surpassing existing methods. This study establishes this methodology as a preliminary means of monitoring in vitro and in tissue treatment modalities which are expected to alter collagen morphology.
This journal is © The Royal Society of Chemistry.
Conflict of interest statement
The authors declare that there are no conflicts of interest.
Figures
Similar articles
-
Differences in collagen architecture between keloid, hypertrophic scar, normotrophic scar, and normal skin: An objective histopathological analysis.Wound Repair Regen. 2009 Sep-Oct;17(5):649-56. doi: 10.1111/j.1524-475X.2009.00533.x. Wound Repair Regen. 2009. PMID: 19769718
-
Hypertrophic and keloid scars fail to progress from the CD34- /α-smooth muscle actin (α-SMA)+ immature scar phenotype and show gradient differences in α-SMA and p16 expression.Br J Dermatol. 2020 Apr;182(4):974-986. doi: 10.1111/bjd.18219. Epub 2019 Sep 4. Br J Dermatol. 2020. PMID: 31206605
-
Collagen fibril network and elastic system remodeling in a reconstructed skin transplanted on nude mice.Matrix Biol. 2001 Nov;20(7):463-73. doi: 10.1016/s0945-053x(01)00162-7. Matrix Biol. 2001. PMID: 11691586
-
Novel Insights on Understanding of Keloid Scar: Article Review.J Am Coll Clin Wound Spec. 2016 Nov 30;7(1-3):1-7. doi: 10.1016/j.jccw.2016.10.001. eCollection 2015 Dec. J Am Coll Clin Wound Spec. 2016. PMID: 28053861 Free PMC article. Review.
-
Keloid and Hypertrophic Scars Are the Result of Chronic Inflammation in the Reticular Dermis.Int J Mol Sci. 2017 Mar 10;18(3):606. doi: 10.3390/ijms18030606. Int J Mol Sci. 2017. PMID: 28287424 Free PMC article. Review.
Cited by
-
Development of a facile method to compute collagen network pathological anisotropy using AFM imaging.Sci Rep. 2023 Nov 17;13(1):20173. doi: 10.1038/s41598-023-47350-y. Sci Rep. 2023. PMID: 37978303 Free PMC article.
-
Dynamic actuation enhances transport and extends therapeutic lifespan in an implantable drug delivery platform.Nat Commun. 2022 Aug 3;13(1):4496. doi: 10.1038/s41467-022-32147-w. Nat Commun. 2022. PMID: 35922421 Free PMC article.
-
A workflow for rapid unbiased quantification of fibrillar feature alignment in biological images.Front Comput Sci. 2021 Oct;3:745831. doi: 10.3389/fcomp.2021.745831. Epub 2021 Oct 14. Front Comput Sci. 2021. PMID: 34888522 Free PMC article.
-
Tailoring Cell Morphomechanical Perturbations Through Metal Oxide Nanoparticles.Nanoscale Res Lett. 2019 Mar 28;14(1):109. doi: 10.1186/s11671-019-2941-y. Nanoscale Res Lett. 2019. PMID: 30923929 Free PMC article.
-
Gene expression modulation in human aortic smooth muscle cells under induced physiological mechanical stretch.Sci Rep. 2024 Dec 28;14(1):31147. doi: 10.1038/s41598-024-82495-4. Sci Rep. 2024. PMID: 39732782 Free PMC article.
References
LinkOut - more resources
Full Text Sources
Other Literature Sources