Ion specific effects on the immobilisation of charged gold nanoparticles on metal surfaces
- PMID: 35540875
- PMCID: PMC9077124
- DOI: 10.1039/c7ra10374c
Ion specific effects on the immobilisation of charged gold nanoparticles on metal surfaces
Abstract
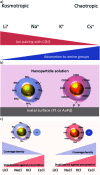
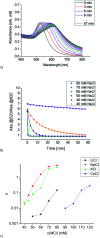
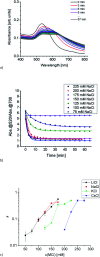
Since the pioneering work of F. Hofmeister, Arch. Exp. Pathol. Pharmakol., 1888, 24, 247, ion specific effects have been steadily reported in the context of colloidal or protein stabilisation in electrolyte solutions. Although the observed effects are omnipresent in chemistry and biology, their origin is still under ferocious discussion. Here, we report on ion specific effects affecting the self-assembly of amine and carboxylic acid functionalised gold nanoparticles on metal surfaces as well as in electrolyte solution as a function of the monovalent cations Li+, Na+, K+ and Cs+. Mercaptooctanoic acid and 1,8-amine-octanethiol functionalised gold nanoparticles were adsorbed on structured AuPd/Pt substrates under addition of the respective chloride salts. Furthermore, the influence of the same salts on the salt induced aggregation of these AuNP was investigated. Our results demonstrate that the assembly processes on the metal surface as well as in electrolyte solution are influenced by the addition of different cations. We attribute the observed effects to ion pairing of the functional end groups with the added cations. With these findings we introduce a new parameter to control the self-assembly of 2D AuNP arrays on solid supports or of 3D AuNP networks in solution, which could be of relevance for the fabrication of new tailor-made functional materials or for biomedical applications.
This journal is © The Royal Society of Chemistry.
Conflict of interest statement
There are no conflicts to declare.
Figures


Similar articles
-
Direct Observation of Ion Pairing at the Liquid/Solid Interfaces by Surface Enhanced Raman Spectroscopy.Langmuir. 2015 Aug 25;31(33):8998-9005. doi: 10.1021/acs.langmuir.5b01903. Epub 2015 Aug 14. Langmuir. 2015. PMID: 26258255
-
The effects of monovalent cations Li+, Na+, K+, NH4+, Rb+ and Cs+ on the solid and solution structures of the nucleic acid components. Metal ion binding and sugar conformation.J Biomol Struct Dyn. 1992 Oct;10(2):345-65. doi: 10.1080/07391102.1992.10508652. J Biomol Struct Dyn. 1992. PMID: 1334674
-
Bridging interactions and selective nanoparticle aggregation mediated by monovalent cations.ACS Nano. 2011 Jan 25;5(1):530-6. doi: 10.1021/nn1025252. Epub 2010 Dec 23. ACS Nano. 2011. PMID: 21182267
-
Specific electrolyte effects on hemoglobin in denaturing medium investigated through electro spray ionization mass spectrometry.J Inorg Biochem. 2022 Sep;234:111872. doi: 10.1016/j.jinorgbio.2022.111872. Epub 2022 May 24. J Inorg Biochem. 2022. PMID: 35653955
-
Beyond the Hofmeister Series: Ion-Specific Effects on Proteins and Their Biological Functions.J Phys Chem B. 2017 Mar 9;121(9):1997-2014. doi: 10.1021/acs.jpcb.6b10797. Epub 2017 Feb 8. J Phys Chem B. 2017. PMID: 28094985 Review.
References
-
- Hofmeister F. Arch. Exp. Pathol. Pharmakol. 1888;24:247.
LinkOut - more resources
Full Text Sources

