. 2021 Dec 24;20(1):A100-A110.
eCollection 2021 Fall.

Pandemic Teaching: Using the Allen Cell Types Database for Final Semester Projects in an Undergraduate Neurophysiology Lab Course

Affiliations

Pandemic Teaching: Using the Allen Cell Types Database for Final Semester Projects in an Undergraduate Neurophysiology Lab Course

Yi-Yun Ho et al. J Undergrad Neurosci Educ. .

Abstract

We designed a final semester research project that allowed students to apply the electrophysiological concepts they learned in a lab course to propose and answer experimental questions without access to laboratory equipment. We created the activity based on lesson plans from Ashley Juavinett and the Allen Institute for Brain Science (AIBS) Allen SDK online examples. An interactive graphic interface was added for students to explore and easily quantify subtle neuronal voltage changes. Before starting the final project, students had experience with conventional extracellular and intracellular recording techniques to record and analyze extracellular action potential firing patterns and intracellular resting, action, and synaptic potentials. They demonstrated their understanding of neural signal transmission in required lab reports using data they gathered before the pandemic shutdown. After students left campus, they continued to analyze data and write lab reports focused on neuronal excitability in snail and fly neurons with data supplied by the instructors. For their final project, students were challenged to answer questions addressing neuronal excitability at both the single neuron and neuronal population level by analyzing and interpreting the open-access, patch clamp recording data from the Allen Cell Types Database using code we provided (Python/Jupyter Notebook). This virtual final semester project allowed students to ask real-world medical and scientific questions from "start to end". Through this project, students developed skills to navigate an extensive online database and gained experience with coding-based data analysis. They chose neuronal populations from human and mouse brains to compare passive properties and neuronal excitability between and within brain areas and across different species and disease states. Additionally, students learned to do simple manipulations of Python code, work remotely in teams, and polish their written scientific presentation skills. This activity could complement other remote learning options such as neuronal simulations. Few online sources offer such a wealth of neuroscience data that students can use for class assignments, and even for research and keystone projects. The activity extends the traditional material often taught in upper-level neuroscience courses, with or without a laboratory section, providing a deeper understanding of the range of excitability properties that neurons express.

Keywords: Allen Cell Types Database; Allen Institute for Brain Science; Jupyter Notebooks; Python; coding; electrophysiology; open access database.


Figures

Figure 1
Figure 1
May 2020 Final Project Timeline. Key events of the implementation are shown. Orange shading: Important deadlines; Green shading: Material delivery dates; Light grey shading: Help sessions.
Figure 2
Figure 2
Screenshot of Allen Cell Types Database Website (http://celltypes.brain-map.org/data). After selecting a neuron and clicking “Electrophysiology” on the lower left of the neuron block in the front page of the website, the patch clamp recording and morphology of the selected neuron are displayed. Different sweep numbers indicating different injection currents can be selected and the corresponding recording trace is displayed.
Figure 3
Figure 3
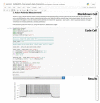
Layout of Jupyter Notebook Interface. Using our final project file as an example, Jupyter Notebook supports markdown cells for writing instructions and code cells for writing code for implementation. After running the code cell, a result is displayed immediately after the code cell. Code was modified from Allen SDK examples (2015).
Figure 4
Figure 4
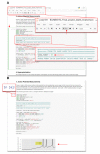
Steps of Running Jupyter Notebook. (A) Students first typed in sweep number for the trace they chose (the middle red box), then clicked on the selected code cell (cell was marked by green edging after clicking), and finally hit the “Run” button in a tool bar on the top (the top red box). (B) After running, a number appears in the blank brackets next to the code cell (as shown in the red box) and the results are displayed after the code cell (as indicated by the red arrow).
Figure 5
Figure 5
Demonstration of the Interactive Graphic Interface. (A) Using Matplotlib backend %matplotlib notebook or %matplotlib widge, an interactive graph was created with a tool bar for manipulating the graph underneath. The square button in the tool bar below the graph (red circle) allows students to zoom-in to a region on the graph (red arrow). (B) This figure shows how an interactive cursor (mplcursors.cursor()) works in Jupyter Notebook. When clicking on the graph generated by the code, a yellow tag appears displaying the x, y values of the point.
Figure 6
Figure 6
Characterizing the Voltage Responses to Hyperpolarization. Students used a large current injection (30mV change) to observe any voltage sag (A, upper graph) and post-inhibitory rebound (B), and a small current injection (5–10mV change) to measure the time constant (C, upper graph). The lower graphs in (A) and in (C) show the current injected. Adapted from students’ final report with permission.
Figure 7
Figure 7
Students Demonstrated Two Methods for Measuring Input Resistance. Students compared the input resistance measured with two methods: (A) measuring the voltage change under a small hyperpolarizing current injection and (B) calculating the slope of a V-I curve. Adapted from students’ final report with permission.
Figure 8
Figure 8
Measuring Instantaneous Firing Rate. Using the Allen SDK (2015) EphysSweepFeatureExtractor to extract time points when action potentials occur, students calculated the instantaneous and average firing rate. This allowed students to observe spike frequency accommodation (A, upper: a firing trace in response to long square pulse; lower: corresponding instantaneous firing rate), characterize the firing properties with ramp injection (B, upper: a firing trace in response to a ramp current; middle: corresponding instantaneous firing rate to the ramp; lower: the amplitude of injected ramp current), and (C) plot an f-I curve to square pulses of different amplitudes. Adapted from students’ final report with permission.
Figure 9
Figure 9
Screenshot of the Code in part IV where editing specific variables was required. Students selected the groups of neurons to analyze through editing these three segments of the code shown in the screenshot: human/mouse, category, and labels. They altered these three segments to specify neurons of different cell types, disease states, cortical layers, dendritic types, or regions of the brain.
Figure 10
Figure 10
Visualization of Differences in Populations. A student group compared action potential amplitudes (A) and membrane time constants I of three major types of inhibitory neurons, parvalbumin neurons, somatostatin neurons, and vasoactive intestinal peptide containing neurons (green, blue, and red). They made these plots by editing code variables and plotting the histogram to visualize the variation found across each electrophysiological property within the population and to compare the range of distribution between each population with code adapted from Juavinett (2020a, . Adapted from students’ final report with permission.
Figure 11
Figure 11
Student Performance on Final Projects Based on Final Group Reports. Numbers show the percentage of complete project outcomes out of total number of groups (12).
Figure 12
Figure 12
Creativity of Students. (A–B) A student group generated a box plot (B) in addition to the required histogram to show the differences of stroke ratio between aspiny and spiny neurons. (C) The same student group compared the threshold of an aspiny neuron to all aspiny neurons from epileptic patients. The solid curve is the probability distribution of thresholds of all aspiny neurons from epileptic patients. The mean of the population was shown in dotted red line and the threshold value of the single neuron they measured was shown in solid black line. Adapted from students’ final report with permission.

Similar articles

Cited by

References

    1. Allen Institute for Brain Science. Allen Cell Types Database. 2015a. Available at http://celltypes.brain-map.org/data.
    1. Allen Institute for Brain Science. Allen SDK. 2015b. Available at http://allensdk.readthedocs.io/en/latest/
    1. Allen Institute for Brain Science. Allen SDK examples. 2015c. Available at http://alleninstitute.github.io/AllenSDK/_static/examples/nb/cell_types.....
    1. Allen Institute. Education Outreach. 2021. Available at https://alleninstitute.org/about/education-outreach/
    1. Akyıldız ST. College students’ views on the pandemic distance education: A focus group discussion. Int J Tech Edu Sci (IJTES) 2020;4(4):322–334.

LinkOut - more resources