. 2018 May 29;8(35):19465-19469.
doi: 10.1039/c8ra02968g. eCollection 2018 May 25.

On how ancillary ligand substitution affects the charge carrier dynamics in dye-sensitized solar cells

Affiliations

On how ancillary ligand substitution affects the charge carrier dynamics in dye-sensitized solar cells

Hashem Shahroosvand et al. RSC Adv. .

Abstract

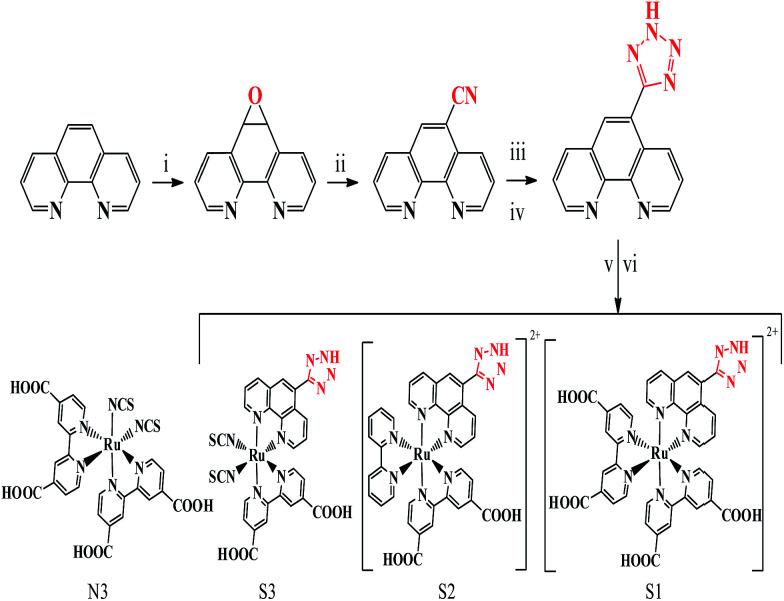
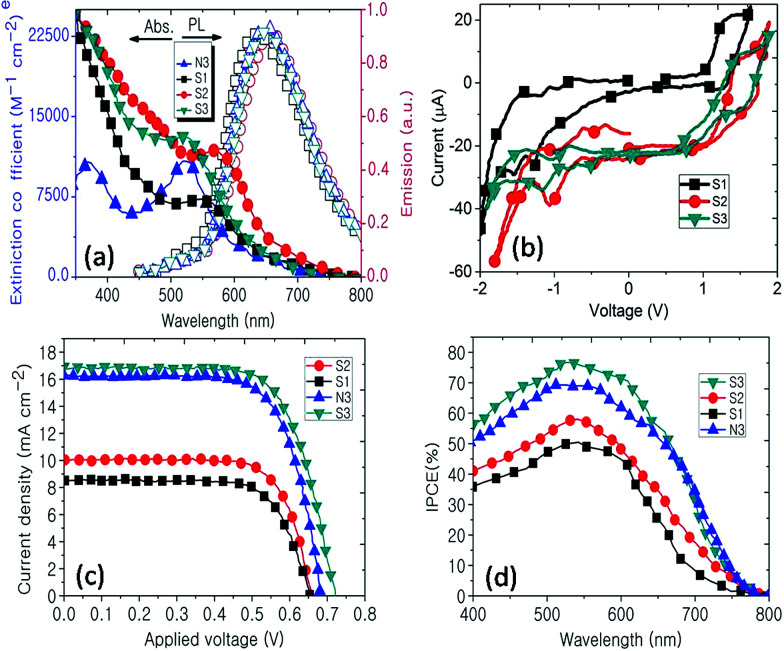
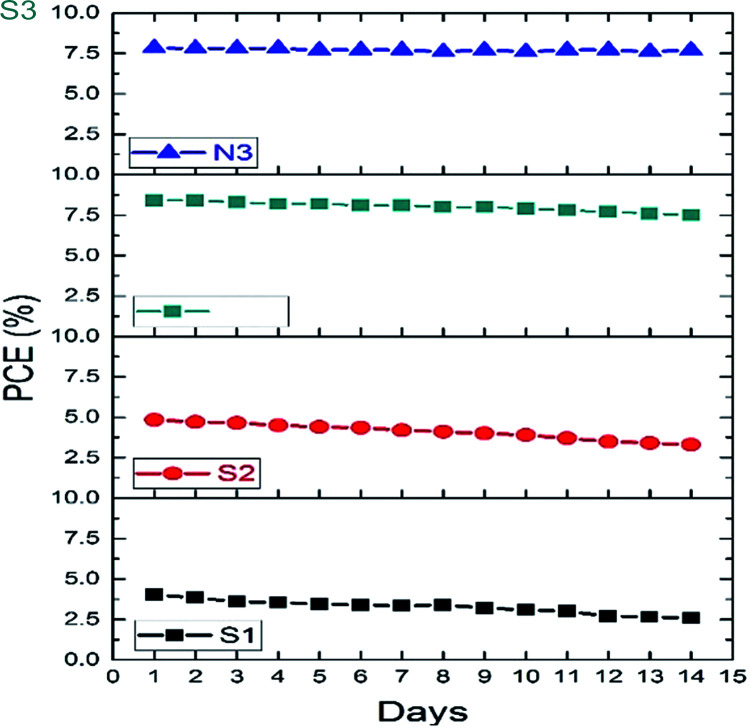
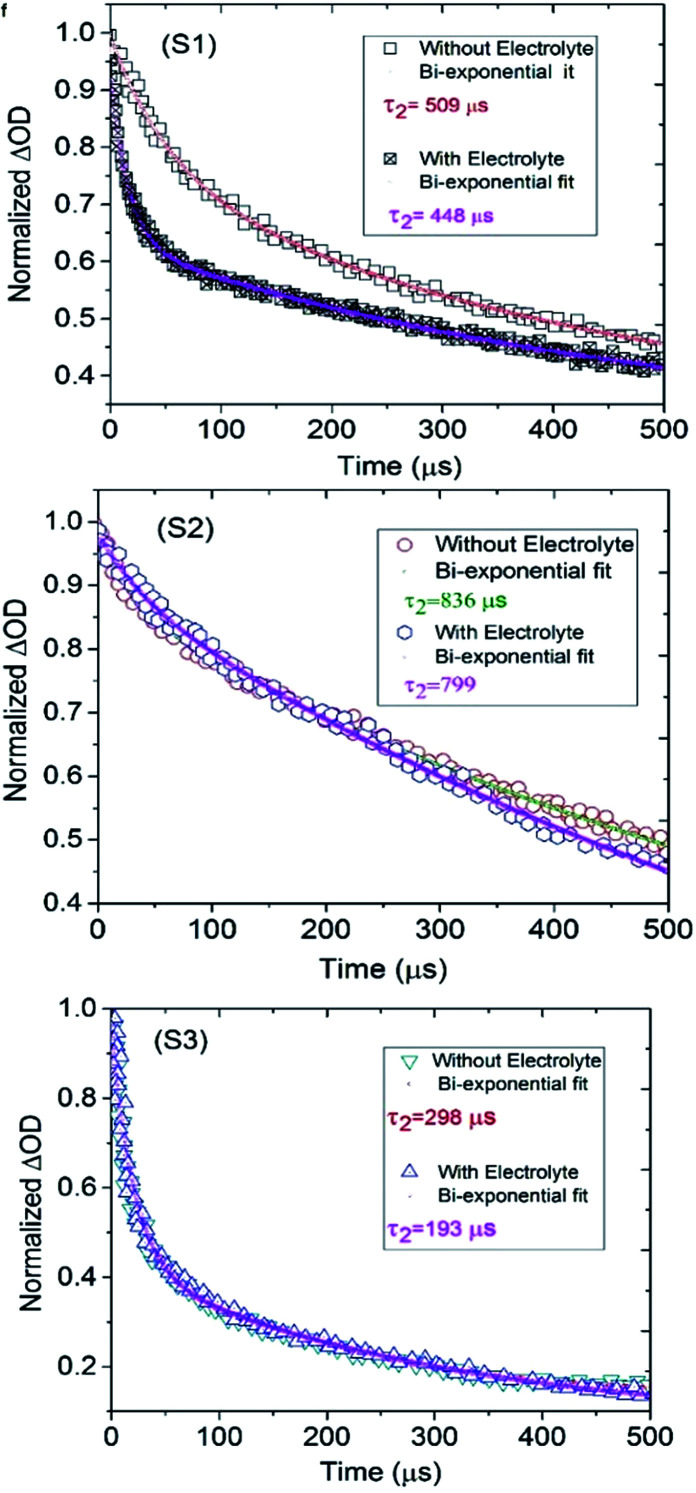
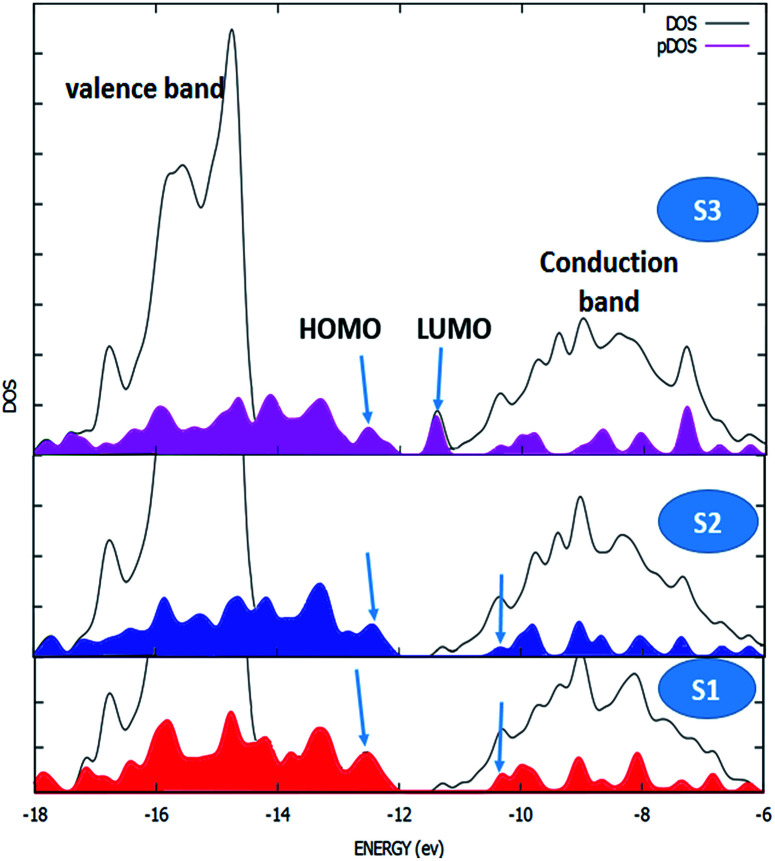
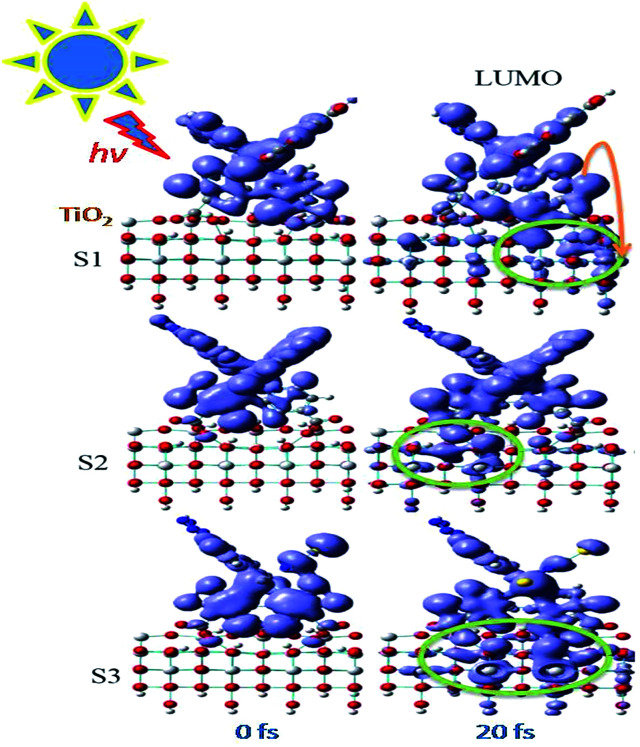
With respect to N3, a champion sensitizer in dye-sensitized solar cells (DSSCs), S3 which contained a phenTz (1,10-phenanthroline 5-tetrazole) ancillary ligand showed outstanding improvements in molar extinction coefficient (ε) from 10 681.8 to 12 954.5 M cm-1 as well as 0.92% and 0.9% increases in power conversion efficiency (PCE) and incident photon-to-electron conversion efficiency (IPCE), reaching 8.46% and 76.5%, respectively. To find the origin of the high performance of the DSSC based on a phenTz ancillary ligand, transient absorption spectroscopy (TA) was carried out and indicated that the rate of the regeneration reaction is about 100 times faster than the rate of recombination with the dye which is very exciting and surely a good reason to promote the phenTz ligand as a promising ancillary ligand in DSSCs.


Conflict of interest statement

There are no conflicts to declare.

Figures

Fig. 1
Fig. 1. The synthesis procedures for phenTz and the S1–S3 complexes. The structure of N3 is shown for comparison.
Fig. 2
Fig. 2. (a) UV-vis and PL spectra of S1–S3 and N3 in ACN solution. (b) Cyclic voltammograms of complexes S1–S3 on a platinum electrode. (c) IV spectra of DSSCs based on S1–S3 and N3. (d) IPCE spectra of S1–S3 and N3.
Fig. 3
Fig. 3. Photostability of the DSSCs based on the new dyes and N3 over time under visible light soaking.
Fig. 4
Fig. 4. Transient absorbance decay profiles obtained upon pulsed laser excitation on TiO2 films sensitized with the dyes (S1–S3), with and without the LiI/I2 electrolyte upon laser excitation at 500 nm. The solid lines are the fits obtained using the bi-exponential decay model.
Fig. 5
Fig. 5. The density of states (DOS) obtained from the extended Hückel method for the S1–S3 anatase model nanostructure. The black line shows the valance band (left) and the conduction band (right) of TiO2. The filled colored curve represents the DOS projected on the basis functions of the adsorbates S1–S3.
Fig. 6
Fig. 6. Snapshots of the electronic charge distribution at 20 fs after initiating the IET from S1–S3 attached to a pristine (101) surface. Only the local TiO2 structure, that next to the photoexcited adsorbate, is illustrated for a detailed view of the time-dependent charge distribution.

Similar articles

Cited by

References

    1. Pashaei B. Shahroosvand H. Gratzel M. Nazeeruddin M. k. Chem. Rev. 2016;16:9485. doi: 10.1021/acs.chemrev.5b00621. - DOI - PubMed
    1. Green M. A. Hishikawa Y. Warta W. et al. . Prog. Photovoltaics. 2017;25:668.
    1. National Renewable Energy Laboratory Efficiency Chart http://www.nrel.gov/ncpv/images/efficiencychart.jpg, accessed January 2017
    1. Tiep H. Ku Z. Fan H. J. Adv. Energy Mater. 2016;6:1501420. doi: 10.1002/aenm.201501420. - DOI
    1. Chiykowski V. A. Lam B. Du C. Berlinguette C. P. Chem. Commun. 2017;53:2547. doi: 10.1039/C6CC09992K. - DOI - PubMed