Fabrication and characterization of a folic acid-bound 5-fluorouracil loaded quantum dot system for hepatocellular carcinoma targeted therapy
- PMID: 35541013
- PMCID: PMC9080723
- DOI: 10.1039/c8ra01025k
Fabrication and characterization of a folic acid-bound 5-fluorouracil loaded quantum dot system for hepatocellular carcinoma targeted therapy
Abstract
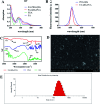
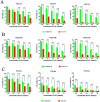
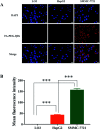
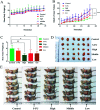
In the present study, we covalently coupled folic acid (FA) and 5-fluorouracil acetic acid (FUA) on the surface of quantum dots (QDs) to produce a tumor targeting drug delivery system, FA-QDs-FUA. The QDs not only act as hepatocellular carcinoma (HCC)-targeted delivery vehicles, but also play a key role in imaging. The structural and optical properties of as-prepared FA-QDs-FUA were characterized using UV-visible spectra, fluorescence spectra, infrared spectra, particle size and zeta potential. In vitro hemolysis activity, cytotoxicity and targeting specificity of the FA-QDs-FUA system were also evaluated. The in vivo anti-tumor efficacy of FA-QDs-FUA in tumor-bearing mice was investigated. The average particle size and zeta potential of FA-QDs-FUA was 220.28 nm and -13.3 mV, respectively. The drug-loading content of FA-QDs-FUA was 36.85% ± 1.61% (n = 3). The in vitro release profile of 5-FU from FA-QDs-FUA demonstrated a slow and sustained release behaviour as compared to free 5-FU drug. The results of the in vitro cellular experiment demonstrated that FA-QDs-FUA reduced cytotoxicity as compared to free 5-FU and targeted more easily hepatocellular carcinoma cells (SMMC-7721 and HepG2) than normal cells. Mice treated with FA-QDs-FUA showed superior tumor suppression compared to those treated with free 5-FU at 4.72 mg kg-1 of 5-FU. Therefore, the FA-QDs-FUA system can be used as a promising candidate for improving 5-FU efficacy and tumor targeting specificity with limited toxicity.
This journal is © The Royal Society of Chemistry.
Conflict of interest statement
There are no conflicts to declare.
Figures


Similar articles
-
The Biological Activity Research of the Nano-Drugs Based on 5-Fluorouracil-Modified Quantum Dots.Int J Nanomedicine. 2020 Apr 23;15:2765-2776. doi: 10.2147/IJN.S244693. eCollection 2020. Int J Nanomedicine. 2020. PMID: 32425520 Free PMC article.
-
Functionalized PAMAM-based Nanoformulation for Targeted Delivery of 5-Fluorouracil in Hepatocellular Carcinoma.Curr Pharm Des. 2022;28(25):2113-2125. doi: 10.2174/1381612828666220506111918. Curr Pharm Des. 2022. PMID: 35524673
-
In vivo tumor targeting and anti-tumor effects of 5-fluororacil loaded, folic acid targeted quantum dot system.J Colloid Interface Sci. 2016 Oct 15;480:146-158. doi: 10.1016/j.jcis.2016.07.011. Epub 2016 Jul 7. J Colloid Interface Sci. 2016. PMID: 27428851
-
In vitro and in vivo evaluation of macromolecular prodrug GC-FUA based nanoparticle for hepatocellular carcinoma chemotherapy.Drug Deliv. 2017 Nov;24(1):459-466. doi: 10.1080/10717544.2016.1264499. Drug Deliv. 2017. PMID: 28219253 Free PMC article.
-
Cytocompatible chitosan-graft-mPEG-based 5-fluorouracil-loaded polymeric nanoparticles for tumor-targeted drug delivery.Drug Dev Ind Pharm. 2018 Mar;44(3):365-376. doi: 10.1080/03639045.2017.1371741. Epub 2017 Dec 5. Drug Dev Ind Pharm. 2018. PMID: 28835136
Cited by
-
A Comprehensive Study on Folate-Targeted Mesoporous Silica Nanoparticles Loaded with 5-Fluorouracil for the Enhanced Treatment of Gynecological Cancers.J Funct Biomater. 2024 Mar 20;15(3):74. doi: 10.3390/jfb15030074. J Funct Biomater. 2024. PMID: 38535267 Free PMC article.
-
Nanomedicine in Hepatocellular Carcinoma: A New Frontier in Targeted Cancer Treatment.Pharmaceutics. 2021 Dec 25;14(1):41. doi: 10.3390/pharmaceutics14010041. Pharmaceutics. 2021. PMID: 35056937 Free PMC article. Review.
-
The Biological Activity Research of the Nano-Drugs Based on 5-Fluorouracil-Modified Quantum Dots.Int J Nanomedicine. 2020 Apr 23;15:2765-2776. doi: 10.2147/IJN.S244693. eCollection 2020. Int J Nanomedicine. 2020. PMID: 32425520 Free PMC article.
References
LinkOut - more resources
Full Text Sources

