Review
. 2018 Jun 18;8(39):22103-22112.
doi: 10.1039/c8ra03530j. eCollection 2018 Jun 13.

Frontier challenges in doping quantum dots: synthesis and characterization

Affiliations
Review

Frontier challenges in doping quantum dots: synthesis and characterization

Mahima Makkar et al. RSC Adv. .

Abstract

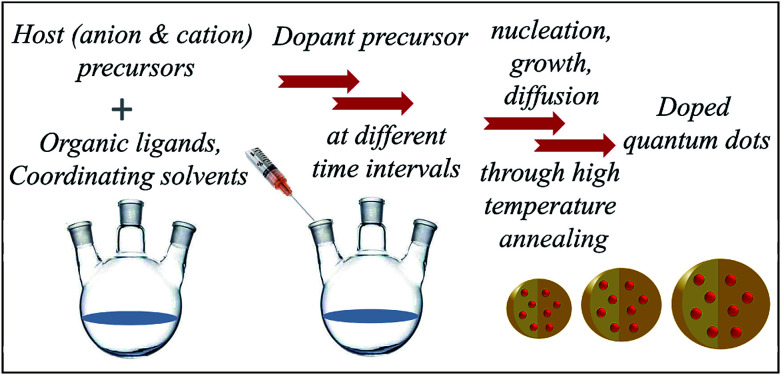
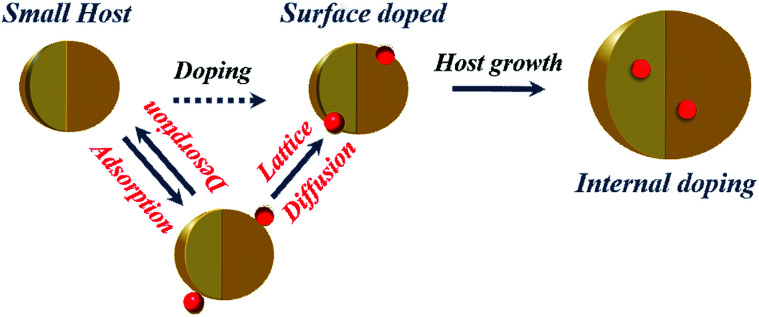
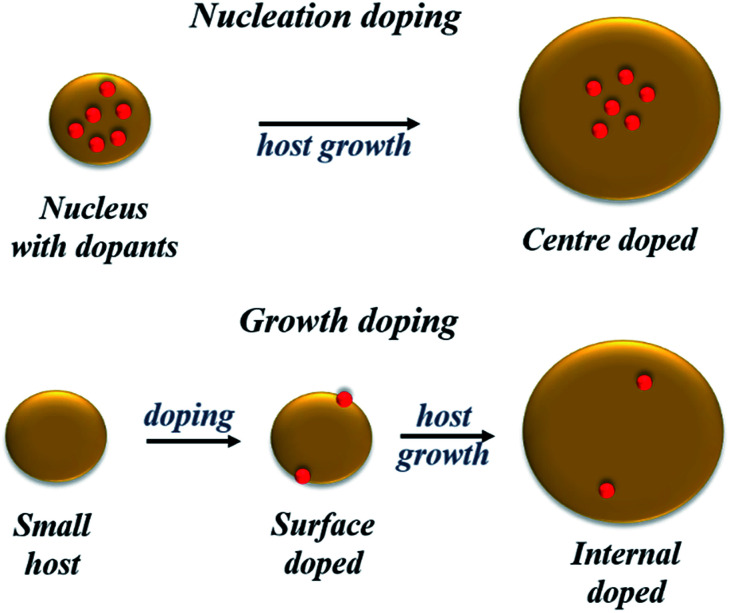
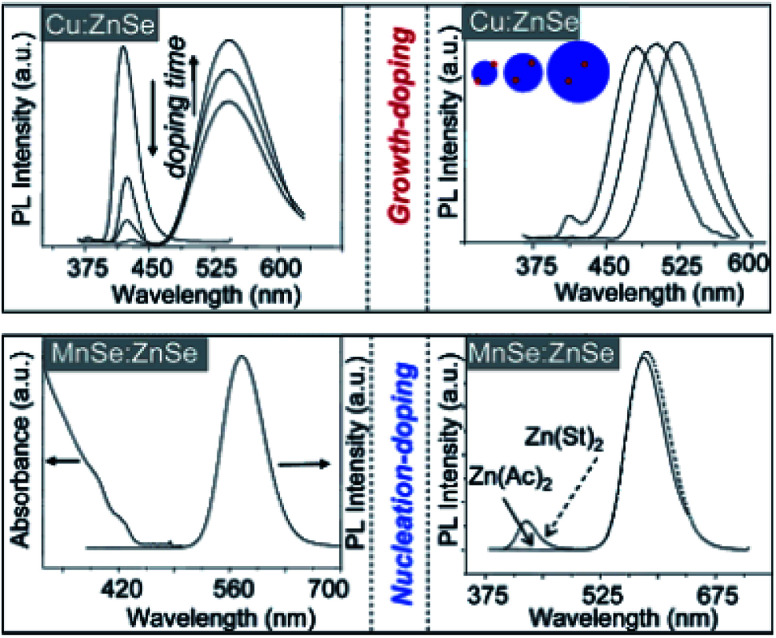
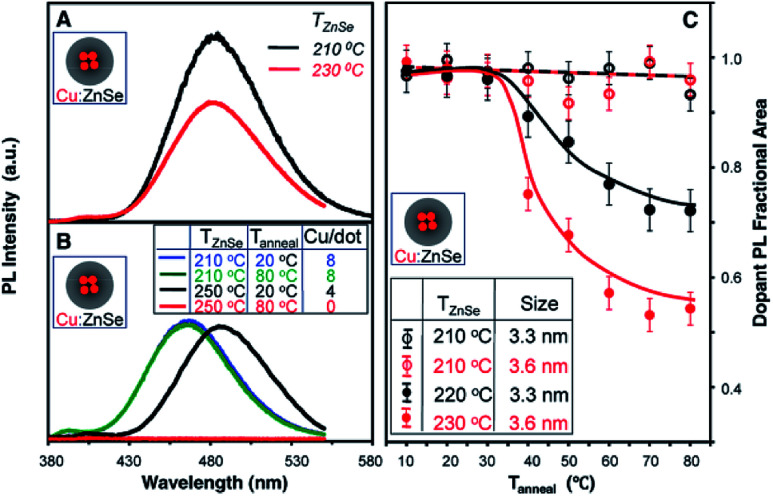
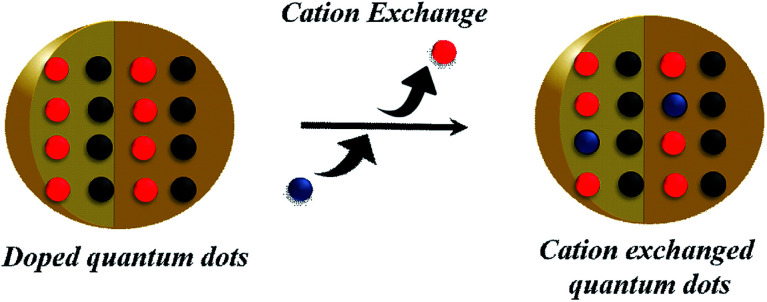
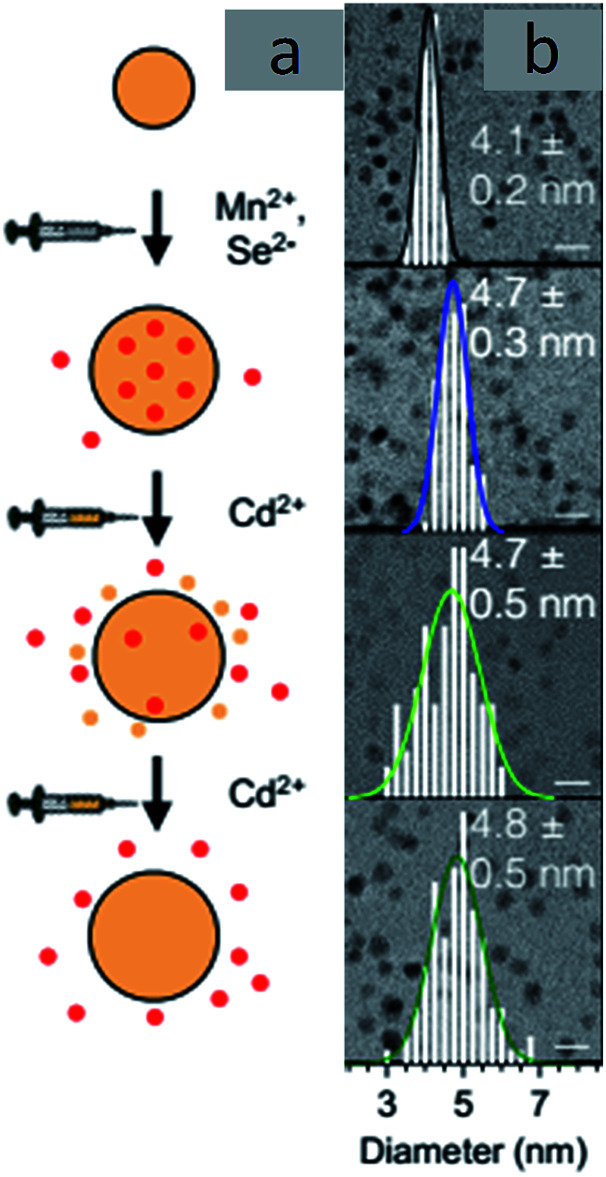
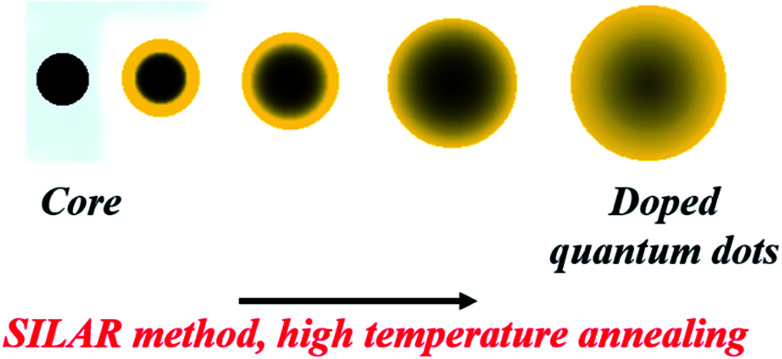
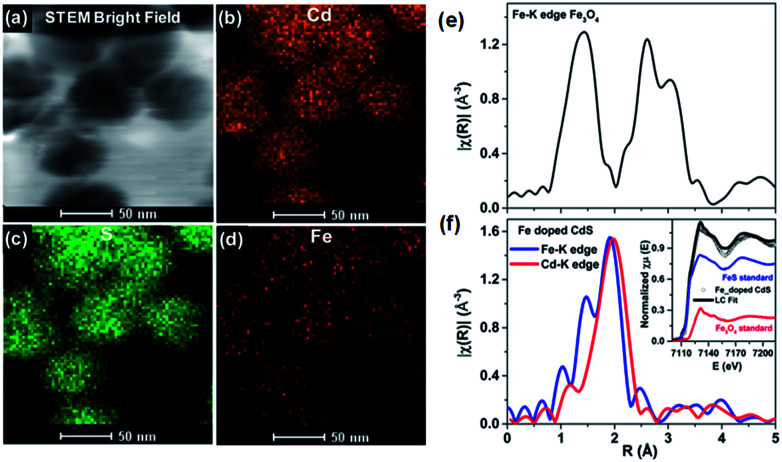
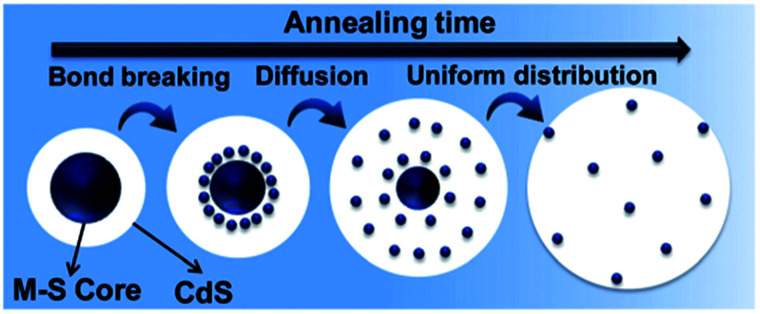
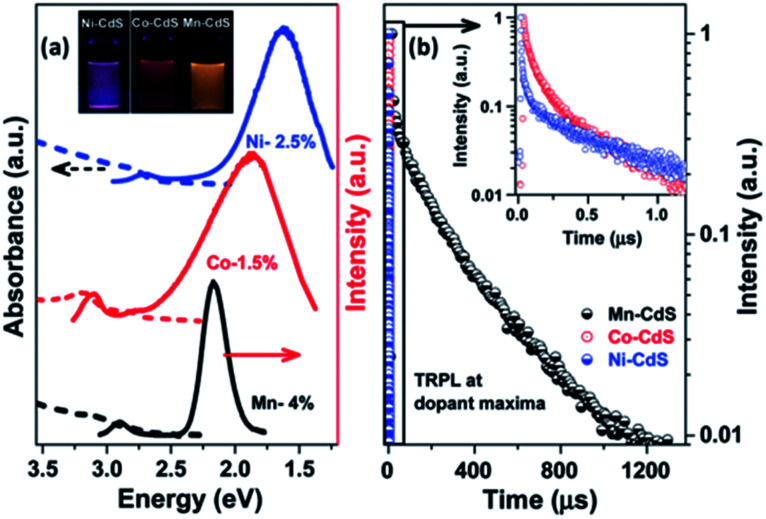
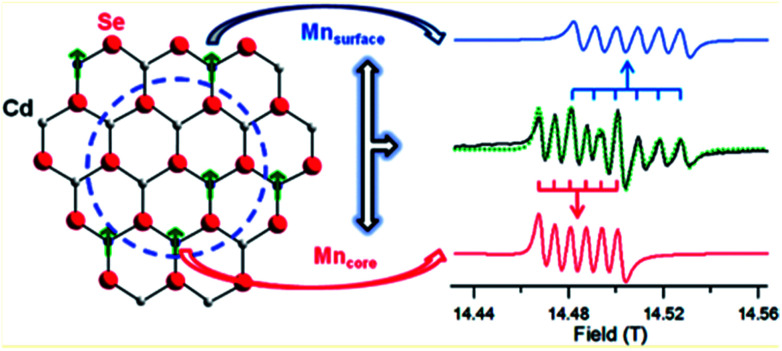
Impurity doping in semiconductor quantum dots (QDs) has numerous prospects in implementing and altering their properties and technologies. Herein, we review the state-of-the-art doping techniques arising from colloidal synthesis methods. We first discuss the advantages and challenges involved in doping; we then discuss various doping techniques, including clustering of dopants as well as expulsion out of the lattice due to self-purification. Some of these techniques have been shown to open up a new generation of robust doped semiconductor quantum dots with cluster-free doping which will be suitable for various spin-based solid-state device technologies and overcome the longstanding challenges of controlled impurity doping. Further, we discuss inhibitors such as defects, clustering and interfaces, followed by current open questions. These include pathways to obtain uniform doping in the required radial position with unprecedented control over the dopant concentration and the size of the QDs.


Conflict of interest statement

There are no conflicts to declare.

Figures

Fig. 1
Fig. 1. Schematic of the general colloidal synthesis of organic ligand-capped doped quantum dots.
Fig. 2
Fig. 2. Schematic of temperature-dependent dopant lattice diffusion.
Fig. 3
Fig. 3. Absorption spectra of CdSe nanocrystals before (dotted line), immediately after (solid line), and 27 hours after (dashed line) the addition of sodium biphenyl reagent. The concurrent optical bleach of the first two exciton transitions and the appearance of infrared absorption can be clearly seen. The blue-shifts of the optical spectra after the disappearance of the infrared absorption suggest that the n-type nanocrystals decompose by the loss of the outermost layer of the semiconductor. Adapted with permission from ref. 44.
Fig. 4
Fig. 4. The plot of drain current IDversus drain-source voltage VDS as a function of the gate voltage VG for an FET nanocrystal with a channel composed of 8 nm PbSe nanocrystals treated with hydrazine solution for 12 hours. Adapted with permission from ref. 47.
Fig. 5
Fig. 5. Schematic of the proposed radial positions of the dopant in nucleation- and growth-doping.
Fig. 6
Fig. 6. Spectroscopic data for nucleation- and growth-doped QDs. Adapted with permission from ref. 49.
Fig. 7
Fig. 7. (A) PL spectra of similar-sized Cu-doped ZnSe QDs prepared at different ZnSe overcoating temperatures (TZnSe) of 230 °C and 210 °C. (B) PL spectra of Cu-doped ZnSe QDs with TZnSe of 250 °C and 210 °C and their corresponding spectra after thermal annealing at 80 °C (Tanneal). The inset table shows the number of Cu ions per nanocrystal (Cu/dot) for the four samples. (C) Fractional areas of the Cu dopant PL of the Cu-doped ZnSe QDs as a function of thermal annealing temperature (Tanneal) for different overcoating temperatures and different nanocrystal sizes. The maximum brightness of the Cu dopant PL for each case was set as 1. Adapted with permission from ref. 42.
Fig. 8
Fig. 8. Schematic of cation exchange.
Fig. 9
Fig. 9. TEM images of Mn-doped CdSe. Adapted with permission from ref. 30.
Fig. 10
Fig. 10. Diffusion of dopants into the CdS matrix to obtain Fe-doped CdS QDs.
Fig. 11
Fig. 11. TEM elemental map of Fe-doped CdS showing STEM: (a) bright field image, (b) Cd map, (c) S map, and (d) Fe map. The magnitude of the Fourier-transformed Fe-K edge EXAFS spectra for Fe3O4 (e) and a comparison of Fe and Cd K-edge Fe-doped CdS (f). The linear combination fit (black solid line) of the Fe K-edge XANES spectra with FeS (blue solid line) and FeO standards (red solid line) is shown in the inset. Adapted with permission from ref. 29.
Fig. 12
Fig. 12. Scheme showing the formation of uniformly doped QDs through bond breaking and diffusion of ions inside the CdS matrix during thermal annealing. Adapted from ref. 43.
Fig. 13
Fig. 13. (a) Steady-state PL (solid line) and absorption (dashed line) of Ni2+ (blue), Co2+ (red) and Mn2+ (black)-doped QDs. (b) Lifetime decay plots for Ni2+, Co2+ and Mn2+-doped CdS collected at the maxima of the broad dopant peaks. The inset of (b) shows the enlarged portion of the lifetime decay of the Ni2+ and Co2+-doped CdS. Adapted from ref. 43.
Fig. 14
Fig. 14. Theoretical fit and deconvolution of the 406.4 GHz HF-EPR spectra allowing assignment of discrete sites for Mn2+ occupying a substitutional Cd2+ site within the core (red) and surface (blue). Adapted with permission from ref. 37.
None
Mahima Makkar
None
Ranjani Viswanatha

Similar articles

Cited by

References

    1. Grandhi G. K. Tomar R. Viswanatha R. ACS Nano. 2012;6:9751–9763. doi: 10.1021/nn304149s. - DOI - PubMed
    1. Bhargava R. N. Gallagher D. Hong X. Nurmikko A. Phys. Rev. Lett. 1994;72:416–419. doi: 10.1103/PhysRevLett.72.416. - DOI - PubMed
    1. Norris D. J. Yao N. Charnock F. T. Kennedy T. A. Nano Lett. 2001;1:3–7. doi: 10.1021/nl005503h. - DOI
    1. Hanif K. M. Meulenberg R. W. Strouse G. F. J. Am. Chem. Soc. 2002;124:11495–11502. doi: 10.1021/ja0262840. - DOI - PubMed
    1. Bonanni A. Dietl T. Chem. Soc. Rev. 2010;39:528–539. doi: 10.1039/B905352M. - DOI - PubMed