Review
. 2018 Jul 20;8(46):25888-25908.
doi: 10.1039/c8ra04491k. eCollection 2018 Jul 19.

Challenges in application of Raman spectroscopy to biology and materials

Affiliations
Review

Challenges in application of Raman spectroscopy to biology and materials

Nikki Kuhar et al. RSC Adv. .

Abstract

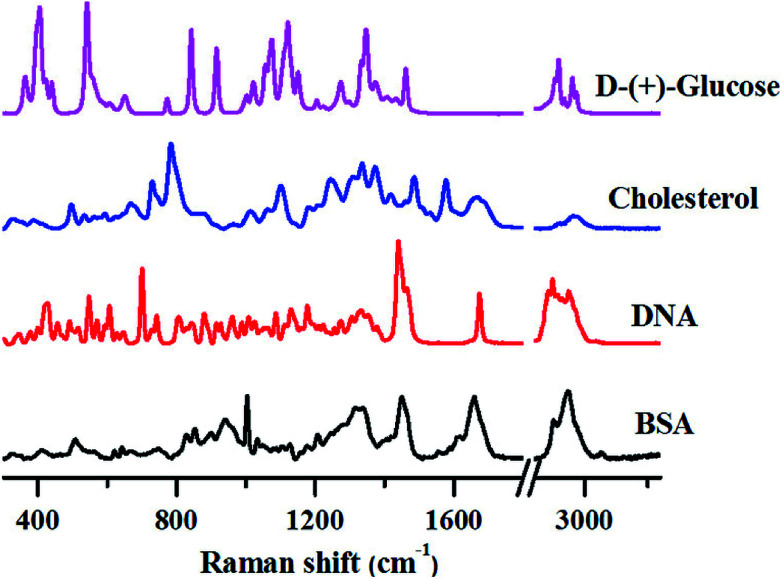
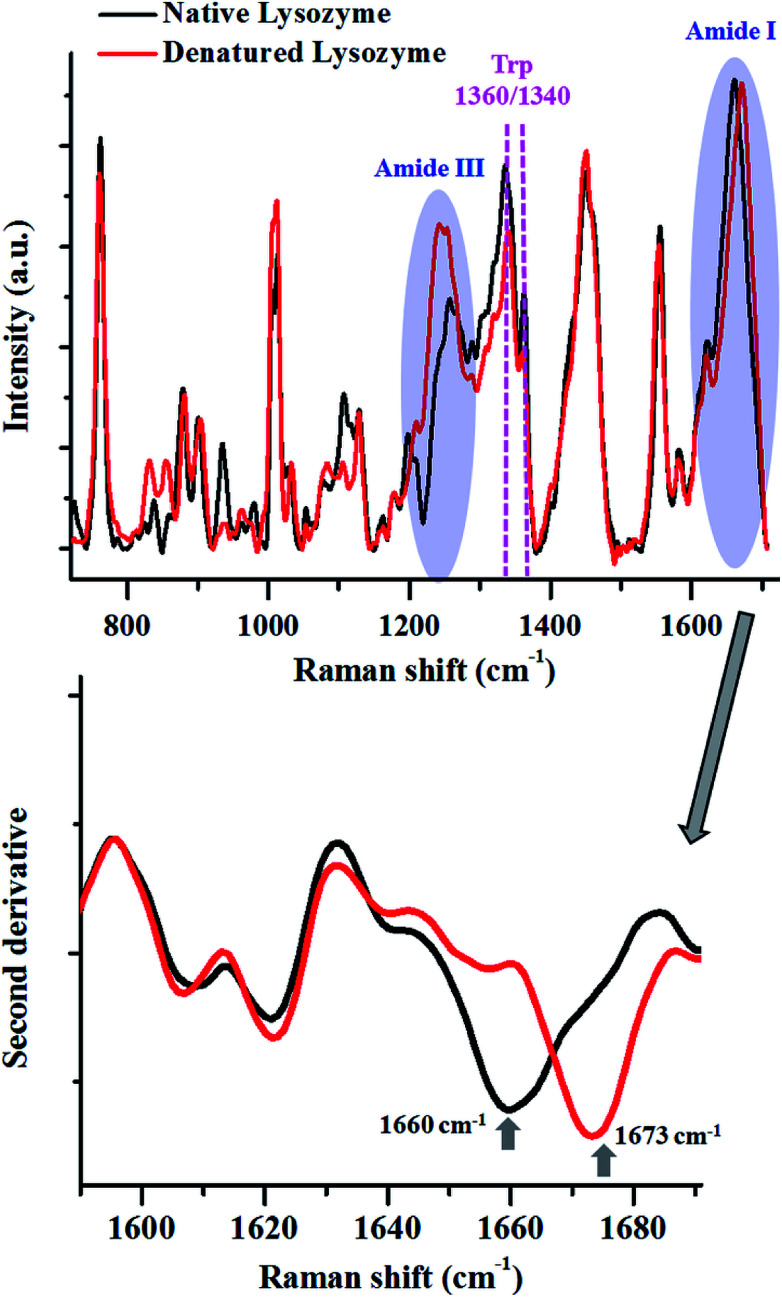
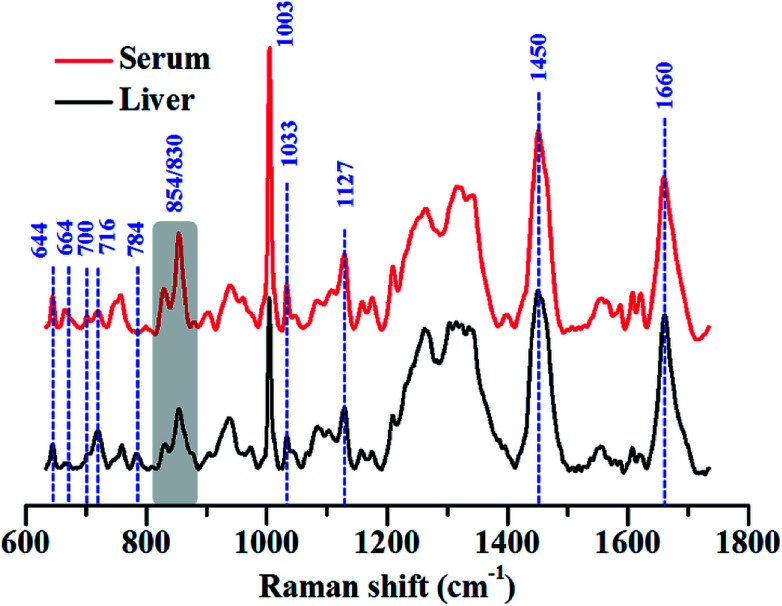
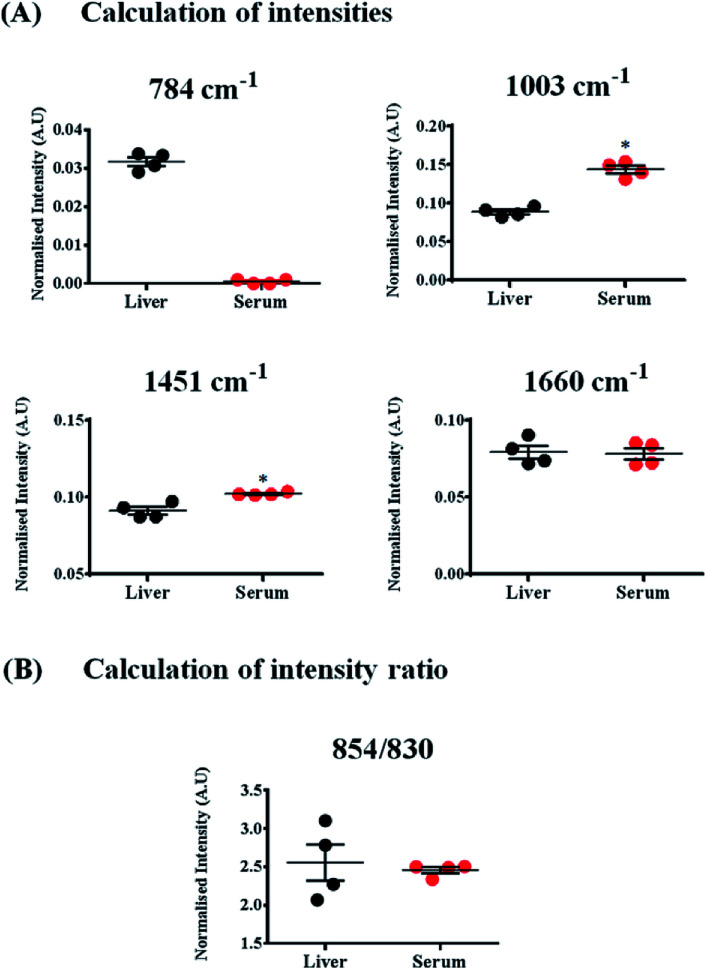
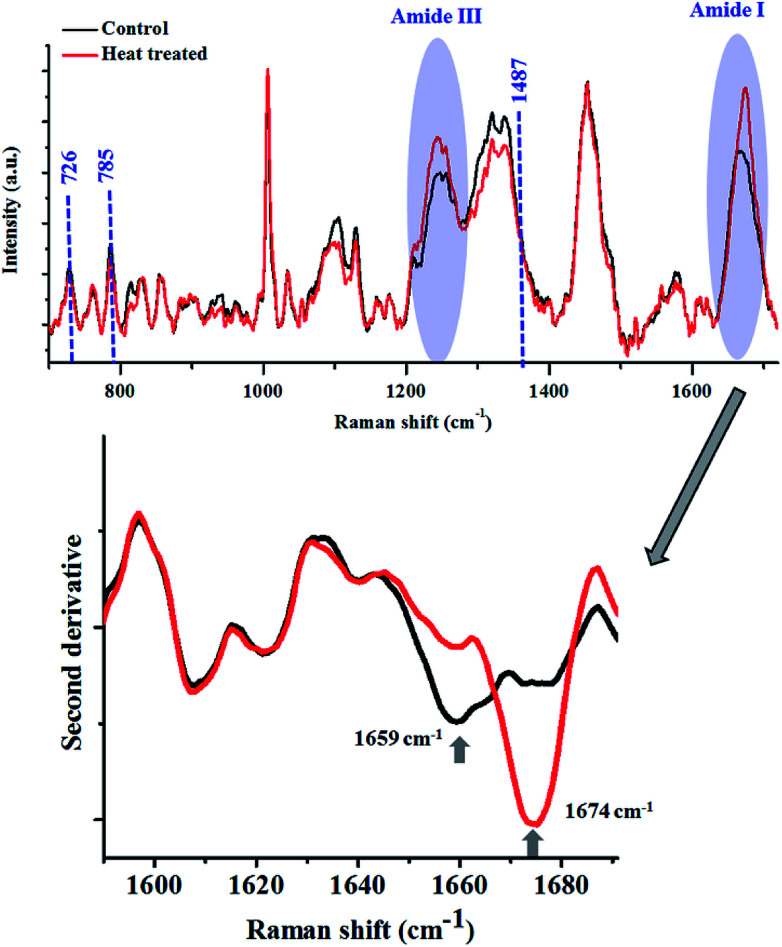
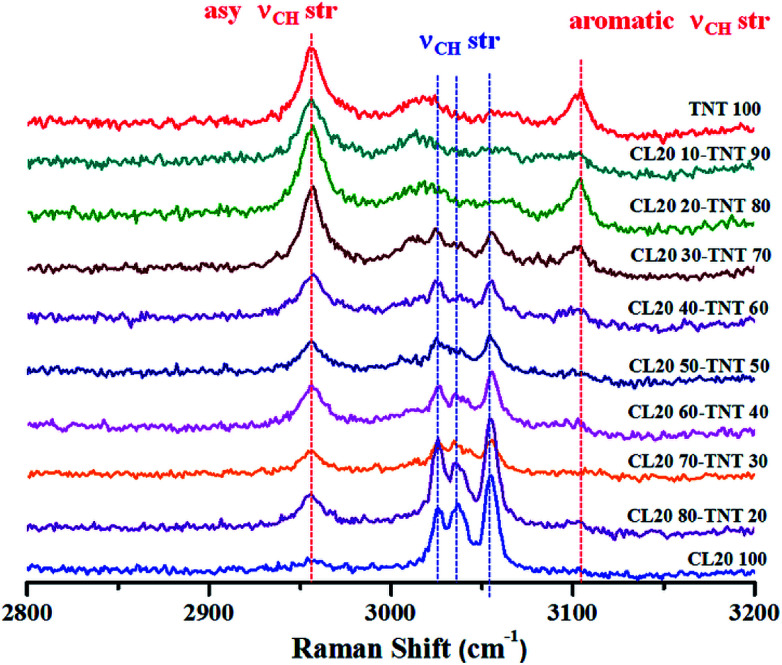
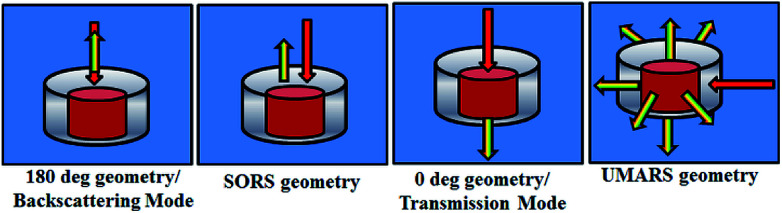
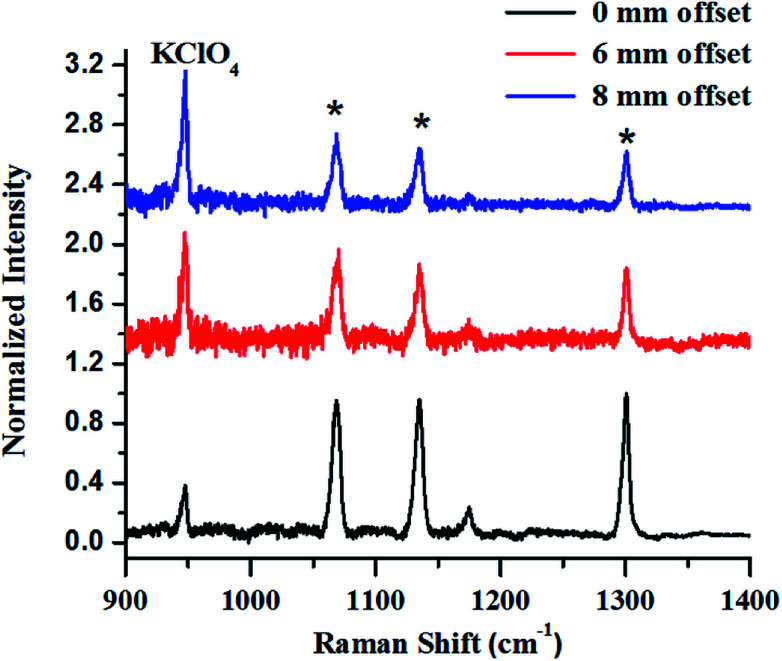
Raman spectroscopy has become an essential tool for chemists, physicists, biologists and materials scientists. In this article, we present the challenges in unravelling the molecule-specific Raman spectral signatures of different biomolecules like proteins, nucleic acids, lipids and carbohydrates based on the review of our work and the current trends in these areas. We also show how Raman spectroscopy can be used to probe the secondary and tertiary structural changes occurring during thermal denaturation of protein and lysozyme as well as more complex biological systems like bacteria. Complex biological systems like tissues, cells, blood serum etc. are also made up of such biomolecules. Using mice liver and blood serum, it is shown that different tissues yield their unique signature Raman spectra, owing to a difference in the relative composition of the biomolecules. Additionally, recent progress in Raman spectroscopy for diagnosing a multitude of diseases ranging from cancer to infection is also presented. The second part of this article focuses on applications of Raman spectroscopy to materials. As a first example, Raman spectroscopy of a melt cast explosives formulation was carried out to monitor the changes in the peaks which indicates the potential of this technique for remote process monitoring. The second example presents various modern methods of Raman spectroscopy such as spatially offset Raman spectroscopy (SORS), reflection, transmission and universal multiple angle Raman spectroscopy (UMARS) to study layered materials. Studies on chemicals/layered materials hidden in non-metallic containers using the above variants are presented. Using suitable examples, it is shown how a specific excitation or collection geometry can yield different information about the location of materials. Additionally, it is shown that UMARS imaging can also be used as an effective tool to obtain layer specific information of materials located at depths beyond a few centimeters.


Conflict of interest statement

There are no conflicts to declare.

Figures

Fig. 1
Fig. 1. Distinctive Raman spectra of various biomolecules. All spectra were collected from powdered samples using 785 nm excitation. Spectra were corrected for cosmic rays and baseline corrected prior to analysis.
Fig. 2
Fig. 2. Raman spectra of lysozyme in its native (black) and thermally denatured (red) state. The major changes in the spectra are highlighted. The shift in the peak maxima of Amide I is shown by the second derivative spectra. Spectra shown in top panel are baseline corrected and vector normalised prior to analysis.
Fig. 3
Fig. 3. Average Raman spectra of liver and blood serum isolated from BALB/c mice. The major peaks that were different across the samples have been highlighted using arrows and the different peak ratios that were considered are highlighted using grey boxes. Each spectrum shown is an average of 200 spectra collected from 4 mice. All spectra were baseline corrected, vector normalised and smoothed prior to analysis.
Fig. 4
Fig. 4. Calculation of Raman band intensities and intensity ratios pertaining to different biomolecules in liver and serum. Marker bands were chosen for each of the biomolecules; (A) DNA (784 cm−1), proteins and lipids (1003, 1451 and 1660 cm−1). (B) Ratiometric analysis of two Raman bands – 830 and 854 cm−1. Each circle in the figure represents an individual mouse. Spectra obtained from a total of 4 mice were used for enumeration. Statistical analysis was performed using Mann–Whitney test where * indicates p < 0.05.
Fig. 5
Fig. 5. Raman spectra of bacterial cells before (black) and after (red) heat treatment. E. coli WT cells were grown for 8 h in shaking condition at 37 °C and 160 rpm. Bacteria were heat treated at 85 °C for 15 minutes. The shift in the peak maxima of Amide I is shown by the second derivative spectra. All spectra in the top panel were corrected for cosmic rays, background subtracted and vector normalised prior to analysis.
Fig. 6
Fig. 6. Raman spectroscopic signatures at higher wavenumber range for CL-20 and TNT melt cast composition at different weight percentages. As the % of one of the component increases, intensity of the corresponding Raman peaks also increases. Data was obtained using 514.5 nm Ar+ ion laser with 1.25 mW power and 10 s acquisition time.
Fig. 7
Fig. 7. Schematic of different experimental geometries employed for obtaining depth specific Raman spectroscopic signatures. Left panel to right depict backscattering, spatially offset Raman spectroscopy (SORS), transmission and Universal Multiple Angle Raman Spectroscopy (UMARS) geometries respectively.
Fig. 8
Fig. 8. (a) Raw SORS signals from KClO4 powder filled in 25 mm square HDPE container with a wall thickness of 3 mm with 0 mm (a), 6 mm (b) and 8 mm (c) offsets respectively. Laser beam was focused on to the container. As the offset is increased to 8 mm, the signal of the sub-surface material improves.
Fig. 9
Fig. 9. Raman signals of layers of KClO4 explosive in a 3 mm thick HDPE container obtained in reflection (backscattering) and right transmission mode.
Fig. 10
Fig. 10. UMARS imaging of bilayer solid powders ammonium nitrate (AN) & trans-stilbene (TS) using 10 optical fibres (830 nm diode laser, laser power: 300 mW, acquisition time: 100 s). The imaging experiments have been carried out by keeping the excitation beam at the interface of the two layers while fibre numbers 1 through 5 were placed around the bottom layer while fibres 6 through were placed around the top layer. TS being a strong Raman scatterer showed intense spots (fibres 1–5, top) on the CCD as compared to AN. Identification of the spatial position is possible with UMARS imaging. Y axis: projection of 10 separate collection fibres on different pixel rows. Spectrum at the top of the figure corresponds to the sum of all y pixels (full vertical binning).
Fig. 11
Fig. 11. Depth sensitive detection of bilayer solid powders ammonium nitrate (outer layer) and t-stilbene (inner layer) using UMARS where, (a) depicts the bilayer cuboid sample schematically, (b) is the Raman intensity variation of AN & TS as the signals were collected by keeping the y-axis constant (y = 4) i.e., at the center of the cuboid and by varying the x at that y, i.e., from x = 1 to x = 7; (c) shows the contour of the bilayer mapped with respect to TS Raman intensity where red colours corresponds to maximum TS intensity, blue corresponds to a minimum value; and (d) shows the 3D surface plot of the variation of TS Raman intensity.
None
Nikki Kuhar
None
Sanchita Sil
None
Taru Verma
None
Siva Umapathy

References

    1. McCreery R. L., Raman Spectroscopy for Chemical Analysis, Wiley, 2005
    1. Das R. S. Agrawal Y. K. Raman spectroscopy: Recent advancements, techniques and applications. Vib. Spectrosc. 2011;57:163–176. doi: 10.1016/j.vibspec.2011.08.003. - DOI
    1. Long D. A., Raman Spectroscopy, McGraw-Hill, New York, 1977
    1. Lyon L. A. Keating C. D. Fox A. P. Baker B. E. He L. Nicewarner S. R. et al., Raman spectroscopy. Anal. Chem. 1998;70:341R–61R. doi: 10.1021/a1980021p. - DOI - PubMed
    1. Vandenabeele P. Edwards H. G. M. Moens L. A decade of Raman spectroscopy in art and archaeology. Chem. Rev. 2007;107:675–686. doi: 10.1021/cr068036i. - DOI - PubMed