

Introducing 12 new dyes for use with oligonucleotide functionalised silver nanoparticles for DNA detection with SERS
- PMID: 35542104
- PMCID: PMC9080490
- DOI: 10.1039/c8ra01998c
Introducing 12 new dyes for use with oligonucleotide functionalised silver nanoparticles for DNA detection with SERS
Abstract
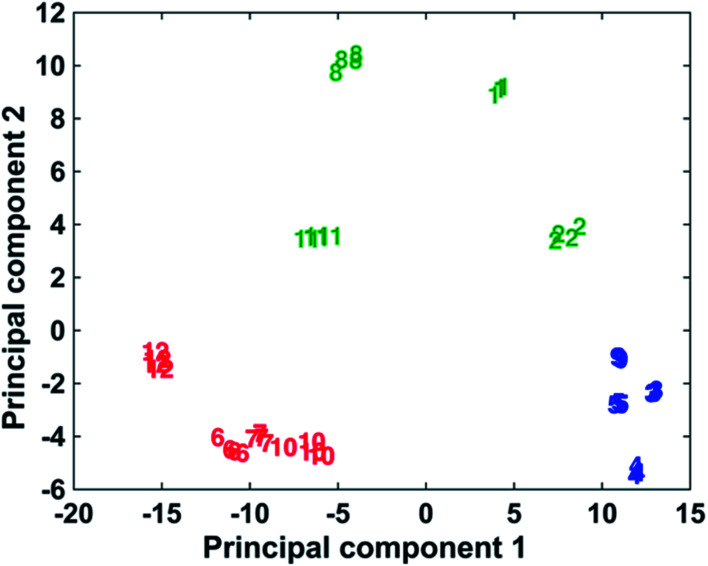
Oligonucleotide functionalised metallic nanoparticles (MNPs) have been shown to be an effective tool in the detection of disease-specific DNA and have been employed in a number of diagnostic assays. The MNPs are also capable of facilitating surface enhanced Raman scattering (SERS) enabling detection to become highly sensitive. Herein we demonstrate the expansion of the range of specific SERS-active oligonucleotide MNPs through the use of 12 new Raman-active monomethine and trimethine chalcogenopyrylium and benzochalcogenopyrylium derivatives. This has resulted in an increased ability to carry out multiplexed analysis beyond the current small pool of resonant and non-resonant Raman active molecules, that have been used with oligonucleotide functionalised nanoparticles. Each dye examined here contains a variation of sulphur and selenium atoms in the heterocyclic core, together with phenyl, 2-thienyl, or 2-selenophenyl substituents on the 2,2',6, and 6' positions of the chalcogenopyrylium dyes and 2 and 2' positions of the benzochalcogenopyrylium dyes. The intensity of SERS obtained from each dye upon conjugate hybridisation with a complementary single stranded piece of DNA was explored. Differing concentrations of each dye (1000, 3000, 5000 and 7000 equivalents per NP-DNA conjugate) were used to understand the effects of Raman reporter coating on the overall Raman intensity. It was discovered that dye concentration did not affect the target/control ratio, which remained relatively constant throughout and that a lower concentration of Raman reporter was favourable in order to avoid NP instability. A relationship between the dye structure and SERS intensity was discovered, leaving scope for future development of specific dyes containing substituents favourable for discrimination in a multiplex by SERS. Methine dyes containing S and Se in the backbone and at least 2 phenyls as substituents give the highest SERS signal following DNA-induced aggregation. Principal component analysis (PCA) was performed on the data to show differentiation between the dye classes and highlight possible future multiplexing capabilities of the 12 investigated dyes.
This journal is © The Royal Society of Chemistry.
Conflict of interest statement
There are no conflicts of interest to declare.
Figures


Similar articles
-
Extreme red shifted SERS nanotags.Chem Sci. 2015 Apr 1;6(4):2302-2306. doi: 10.1039/c4sc03917c. Epub 2015 Jan 21. Chem Sci. 2015. PMID: 29308144 Free PMC article.
-
Preferential Attachment of Specific Fluorescent Dyes and Dye Labeled DNA Sequences in a Surface Enhanced Raman Scattering Multiplex.Anal Chem. 2016 Jan 19;88(2):1147-53. doi: 10.1021/acs.analchem.5b02776. Epub 2016 Jan 6. Anal Chem. 2016. PMID: 26698880
-
Multiplexing potential of NIR resonant and non-resonant Raman reporters for bio-imaging applications.Analyst. 2023 Nov 20;148(23):5915-5925. doi: 10.1039/d3an01298k. Analyst. 2023. PMID: 37850265 Free PMC article.
-
Detection of SERS active labelled DNA based on surface affinity to silver nanoparticles.Analyst. 2012 May 7;137(9):2063-8. doi: 10.1039/c2an35112a. Epub 2012 Mar 21. Analyst. 2012. PMID: 22434199
-
Applications of magnetic nanoparticles in surface-enhanced Raman scattering (SERS) detection of environmental pollutants.J Environ Sci (China). 2019 Jun;80:14-34. doi: 10.1016/j.jes.2018.07.004. Epub 2018 Jul 29. J Environ Sci (China). 2019. PMID: 30952332 Review.
References
LinkOut - more resources
Full Text Sources
Miscellaneous