. 2019 Dec 19;9(72):42132-42139.
doi: 10.1039/c9ra08914d. eCollection 2019 Dec 18.

Intrahepatic fatty acids composition as a biomarker of NAFLD progression from steatosis to NASH by using 1H-MRS

Affiliations

Intrahepatic fatty acids composition as a biomarker of NAFLD progression from steatosis to NASH by using 1H-MRS

Aline Xavier et al. RSC Adv. .

Abstract

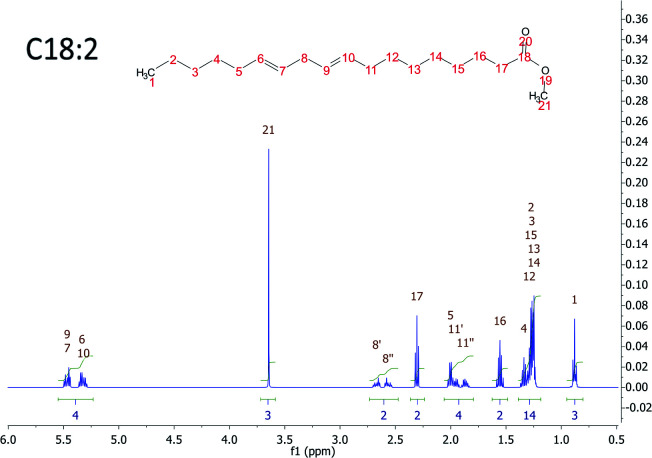
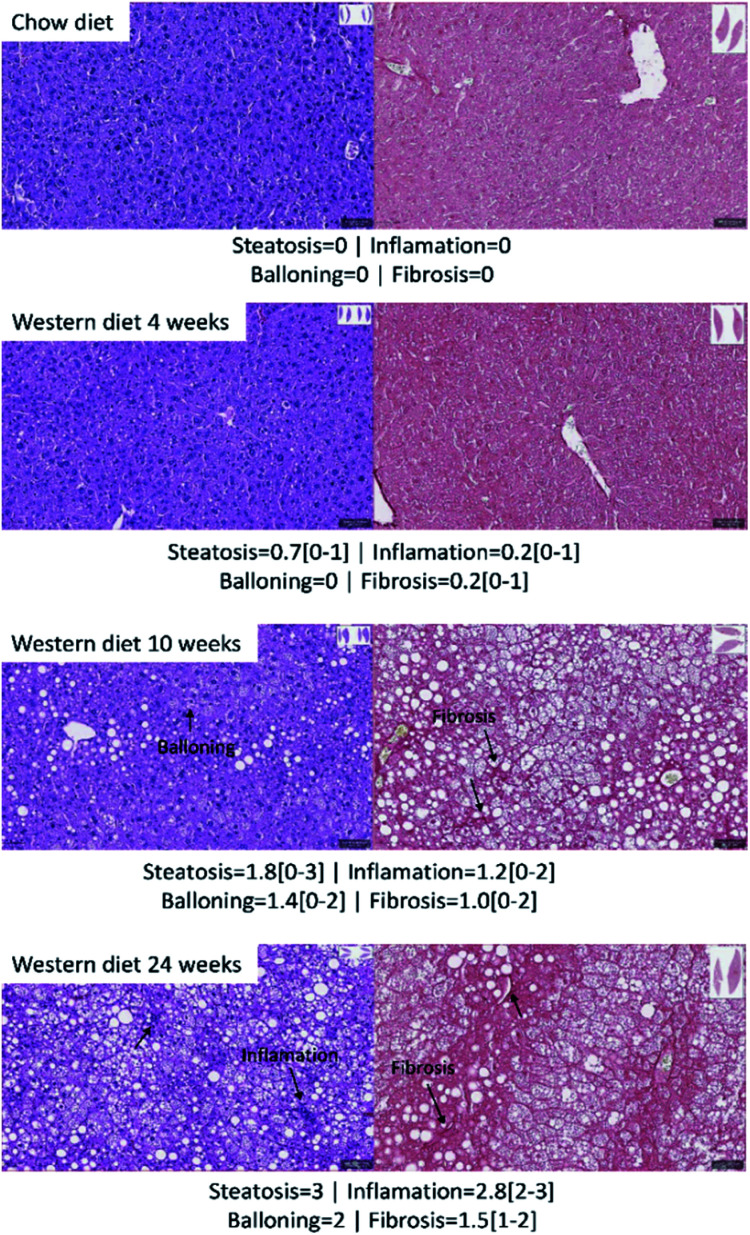
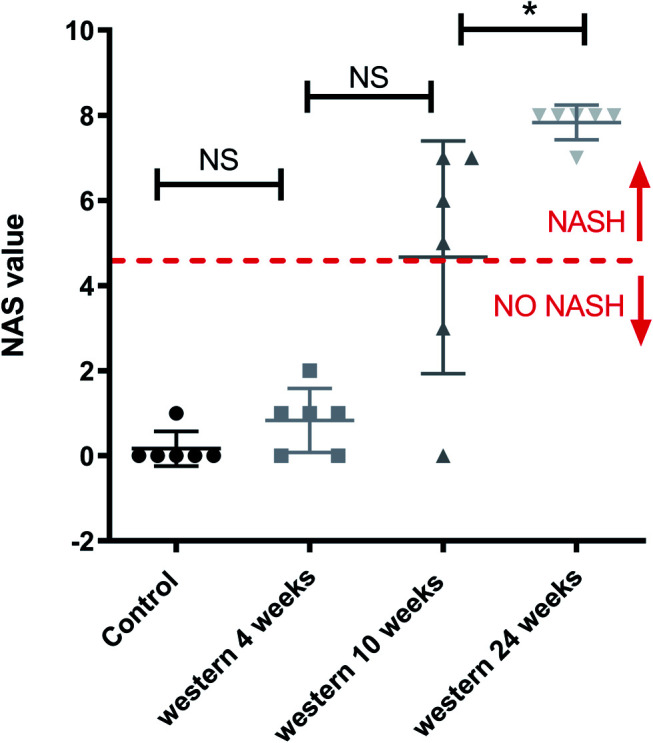
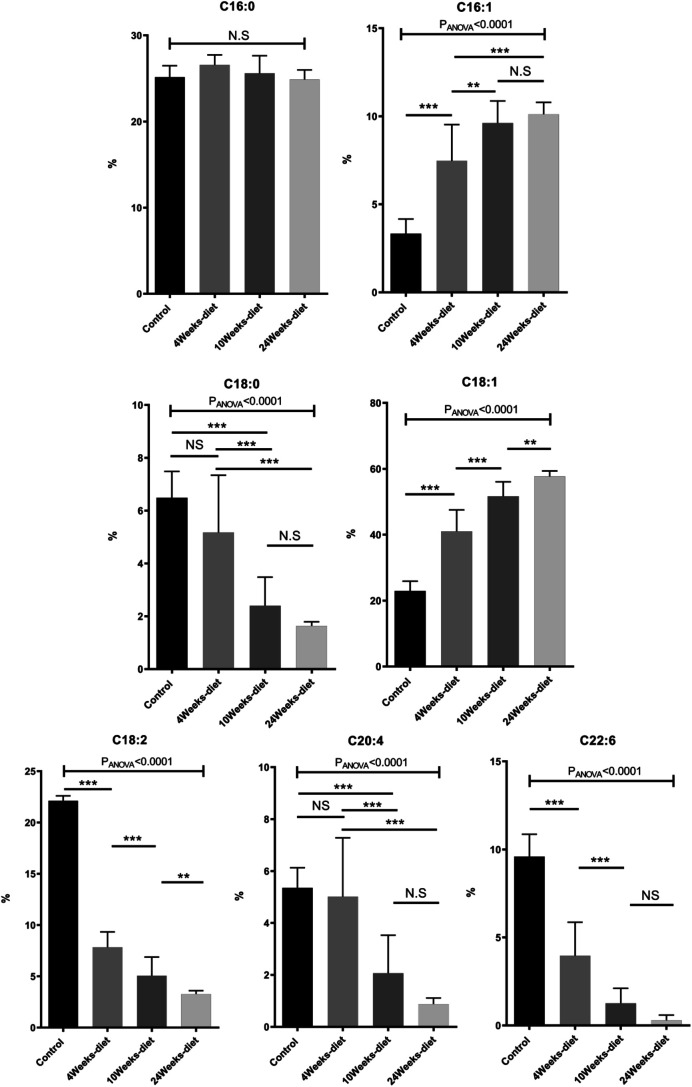
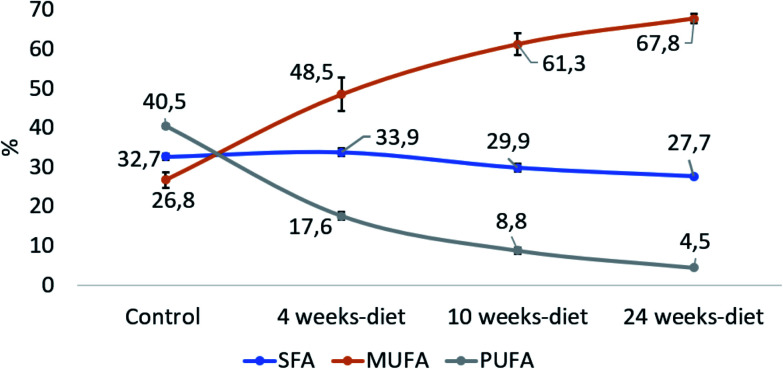
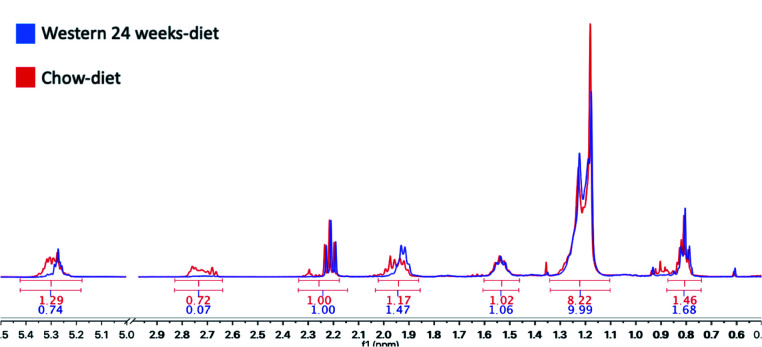
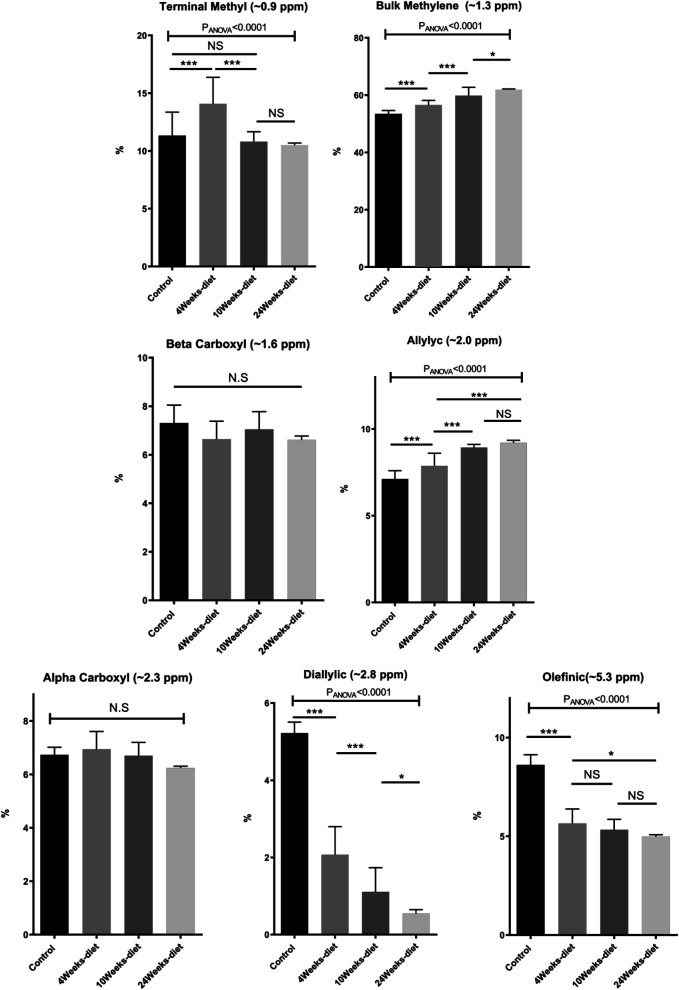
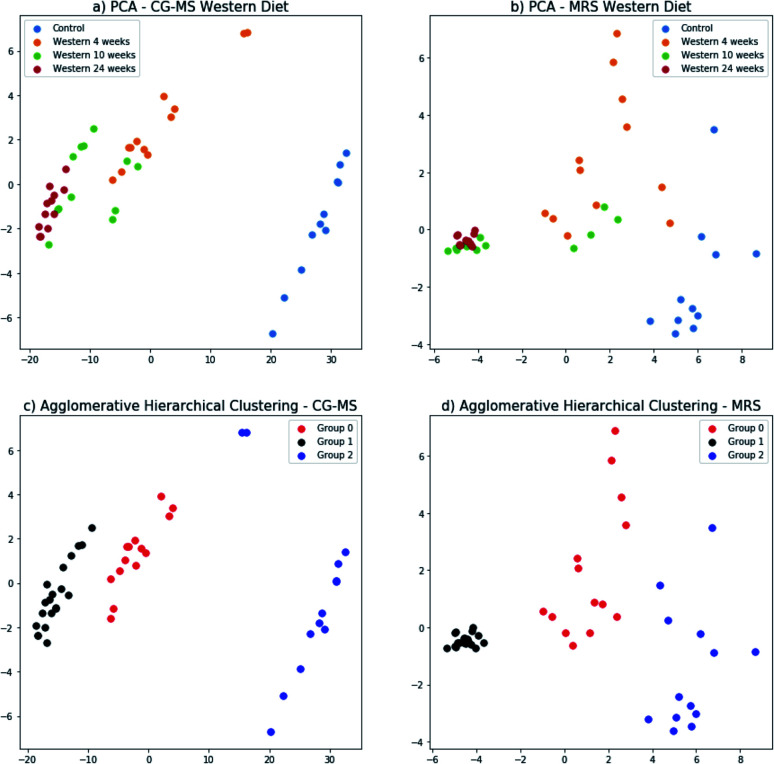
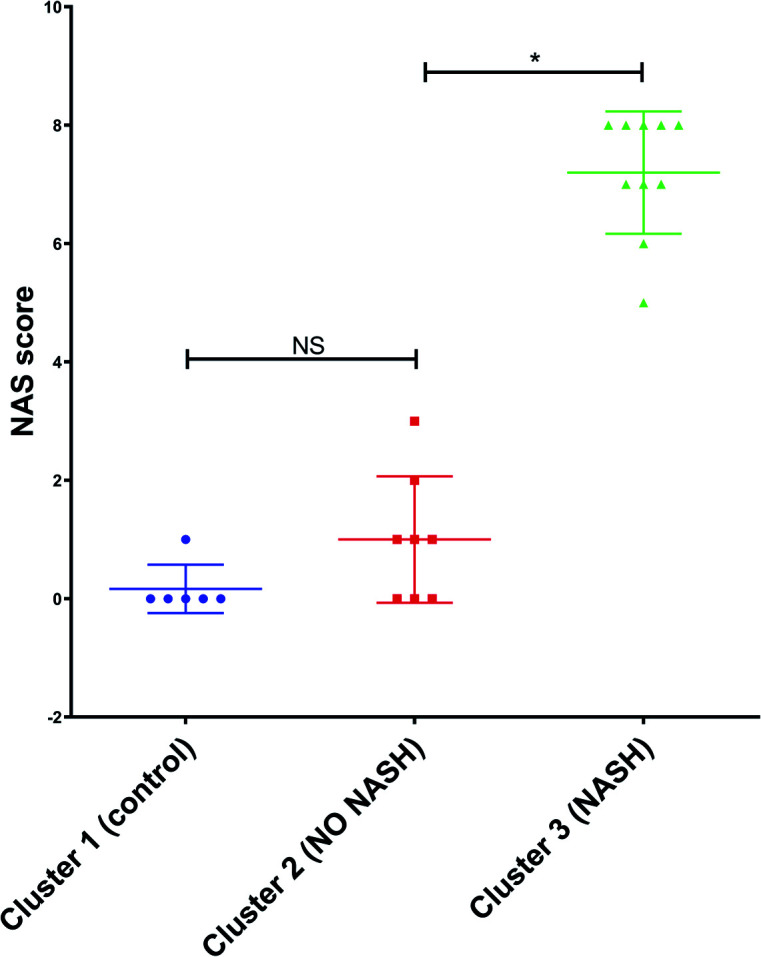
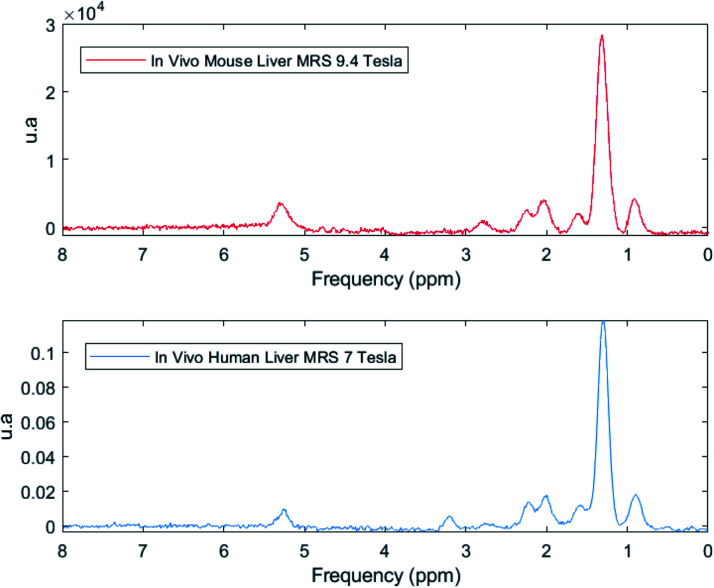
Non-alcoholic fatty liver disease (NAFLD) is the most common liver disease in the world and it is becoming one of the most frequent cause of liver transplantation. Unfortunately, the only available method that can reliably determine the stage of this disease is liver biopsy, however, it is invasive and risky for patients. The purpose of this study is to investigate changes in the intracellular composition of the liver fatty acids during the progression of the NAFLD in a mouse model fed with Western diet, with the aim of identify non-invasive biomarkers of NAFLD progression based in 1H-MRS. Our results showed that the intracellular liver fatty acid composition changes as NAFLD progresses from simple steatosis to steatohepatitis (NASH). Using principal component analysis with a clustering method, it was possible to identify the three most relevant clinical groups: normal, steatosis and NASH by using 1H-MRS. These results showed a good agreement with the results obtained by GC-MS and histology. Our results suggest that it would be possible to detect the progression of simple steatosis to NASH using 1H-MRS, that has the potential to be used routinely in clinical application for screening high-risk patients.


Conflict of interest statement

There are no conflicts to declare.

Figures

Fig. 1
Fig. 1. MRS simulation of a FAME with 18 carbons and 2 double bonds. The proton chemically equivalent are shown in numbers.
Fig. 2
Fig. 2. Hepatic histology results with hematoxylin/eosin (left) and picrosirius red (right). The average score and the range of steatosis, ballooning, inflammation and fibrosis for each group is shown below the image.
Fig. 3
Fig. 3. Boxplot of NAS score and value for each mouse individually. NAS value varies between 0 and 8: a value bigger or equal to 5 means that the mouse has NASH.*p < 0.05 (significant difference between groups) and NS (no significant difference between groups).
Fig. 4
Fig. 4. Change in fatty acids composition measured with GC-MS (mean ± SD) for the four different groups of mice (control or chow diet, 4 weeks of Western diet, 10 weeks of Western diet and 24 weeks of Western diet). *p < 0.05, **p < 0.01, ***p < 0.001 (significant difference between groups) and NS (no significant difference between groups).
Fig. 5
Fig. 5. The relative contribution of each group of fatty acids: saturated fatty acids (SFA: C14 : 0, C15 : 0, C16 : 0, C18 : 0), monounsaturated fatty acids (MUFA, C16 : 1, C18 : 1) and polyunsaturated fatty acids (PUFA, C18 : 2, C18 : 3, C20 : 3, C20 : 4, C20 : 5 C22 : 6).
Fig. 6
Fig. 6. Areas under the curve (AUC) calculated with MestreNova V10.0. In red, the results of a control mouse with a chow-diet and in blue, a mouse with a Western diet for 24 weeks.
Fig. 7
Fig. 7. Change in the AUC of the 7 peaks measured in the 1H-MRS (mean ± SD) for the four different groups of mice (control or chow diet, 4 weeks of Western diet, 10 weeks of Western diet and 24 weeks of Western diet). *p < 0.05, **p < 0.01, ***p < 0.001 (significant differences between groups) and NS (no significant difference between groups).
Fig. 8
Fig. 8. Principal component analysis of GC-MS results (a) and MRS results (b) for all the groups of mice (control, 4 weeks Western diet, 10 weeks Western diet, and 24 weeks Western diet). Agglomerative hierarchical clustering method to cluster the data of GC-MS (c) and MRS (d). x-axis id the principal component 1 and y-axis is the principal component 2.
Fig. 9
Fig. 9. NAS score for each cluster found by PCA with the data from GC-MS and MRS. *p < 0.05 (significant difference between groups) and NS (no significant difference between groups).
Fig. 10
Fig. 10. In vivo MR spectra from a 9.4 Tesla in a mouse (red) and 7 Tesla in human (blue) showing that it is possible to identify all the seven peaks correspondent to the fat spectrum in the liver.

References

    1. Friedman S. L. Neuschwander-Tetri B. A. Rinella M. Sanyal A. J. Nat. Med. 2018;24(7):908–922. doi: 10.1038/s41591-018-0104-9. - DOI - PMC - PubMed
    1. Wiliams R. and Taylor-Robinson S. D., Clinical Dilemmas in Non-Alcoholic Fatty Liver Disease, 1st edn, 2016
    1. Younossi Z. M. Koenig A. B. Abdelatif D. Fazel Y. Henry L. Wymer M. Hepatology. 2016;64(1):73–84. doi: 10.1002/hep.28431. - DOI - PubMed
    1. Neumann M. G. Cohem L. B. Can. J. Gastroenterol. Hepatol. 2014;28(11):607–618. doi: 10.1155/2014/757929. - DOI - PMC - PubMed
    1. Perry R. J. Zhang D. Zhang X. M. L Boyer J. Shulman G. I. Science. 2015;347:1253–1256. doi: 10.1126/science.aaa0672. - DOI - PMC - PubMed