

Apex Predator Nematodes and Meso-Predator Bacteria Consume Their Basal Insect Prey through Discrete Stages of Chemical Transformations
- PMID: 35543104
- PMCID: PMC9241642
- DOI: 10.1128/msystems.00312-22
Apex Predator Nematodes and Meso-Predator Bacteria Consume Their Basal Insect Prey through Discrete Stages of Chemical Transformations
Abstract
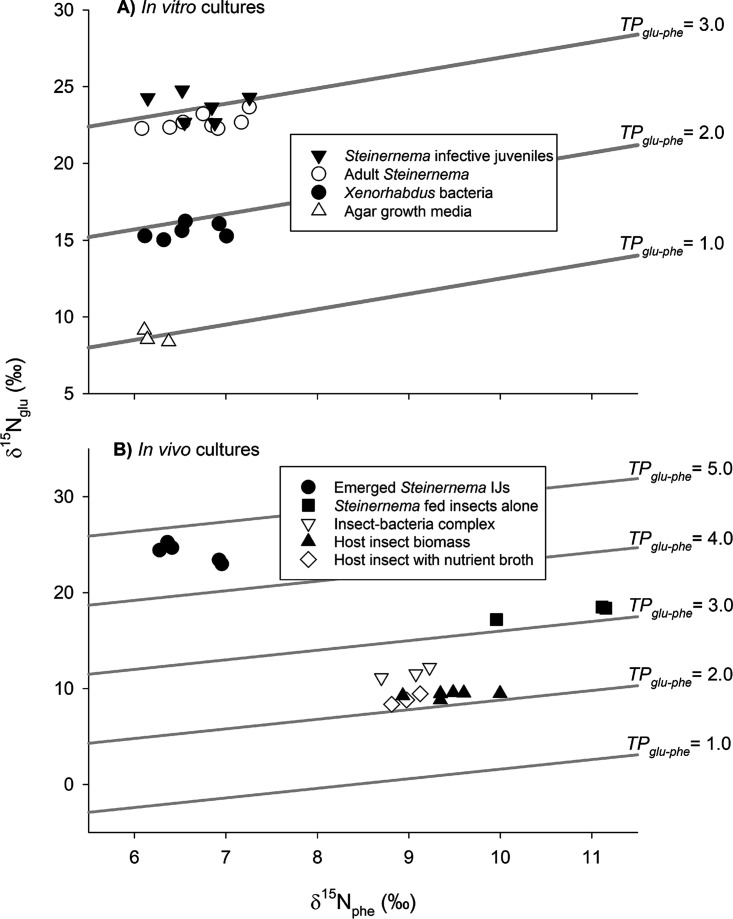
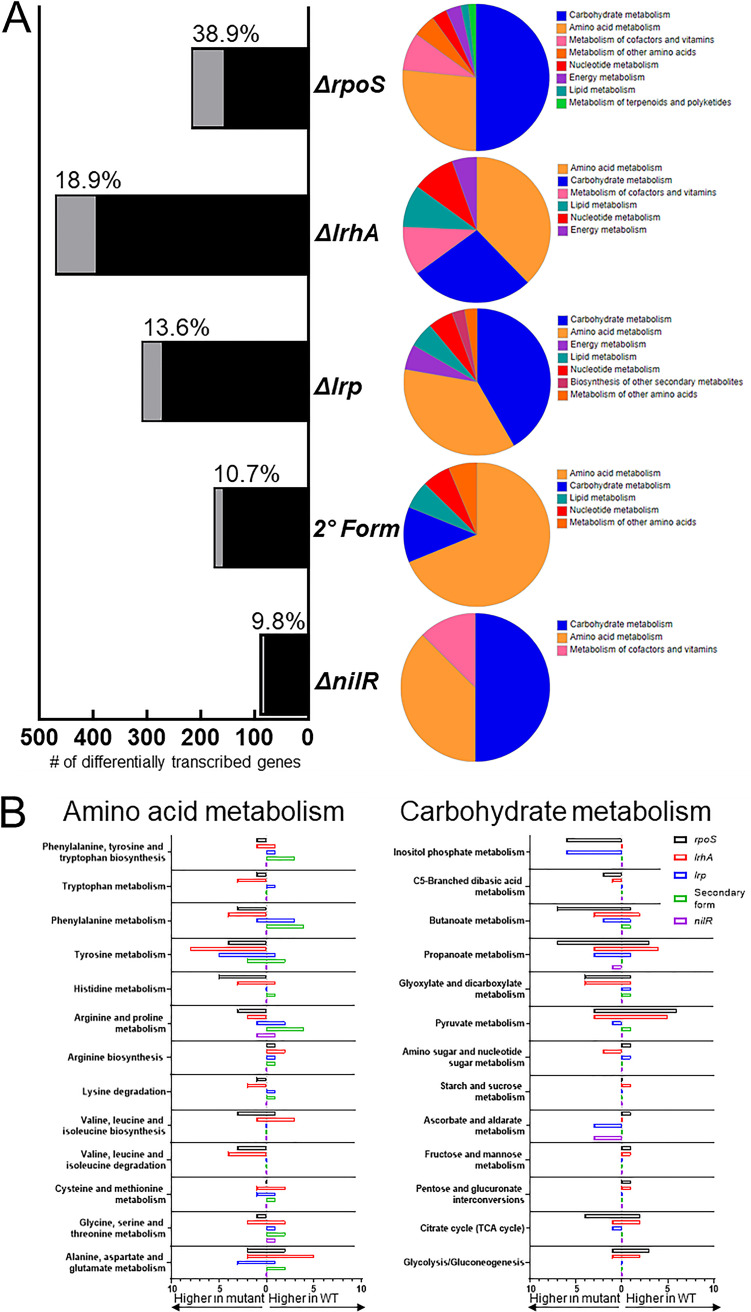
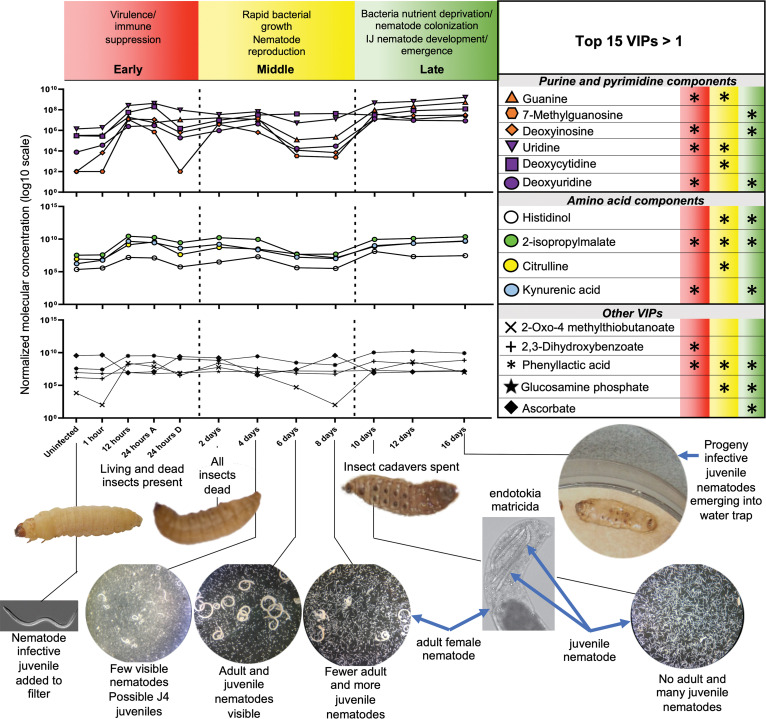
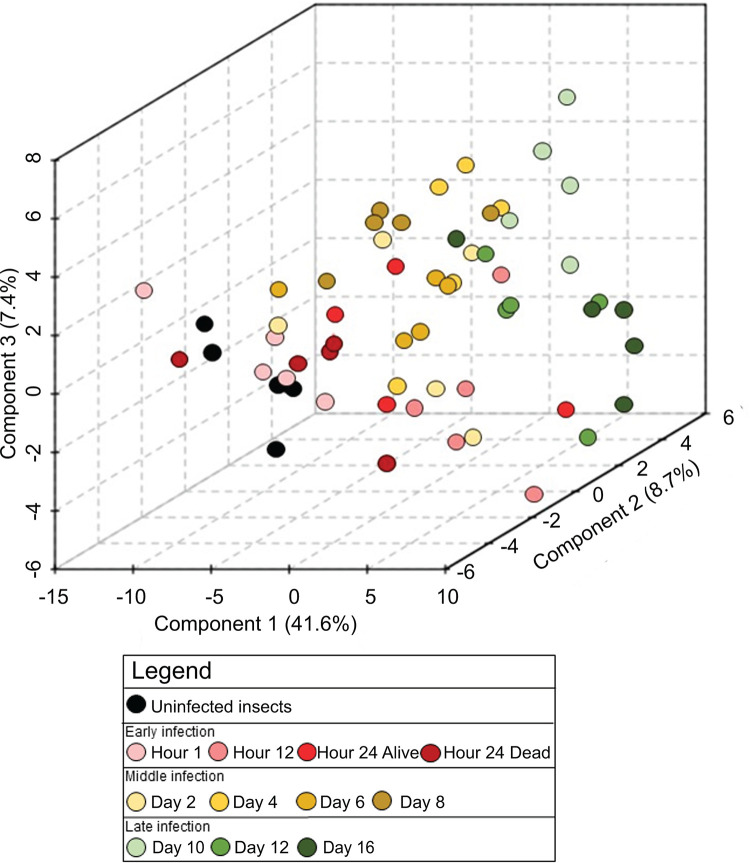
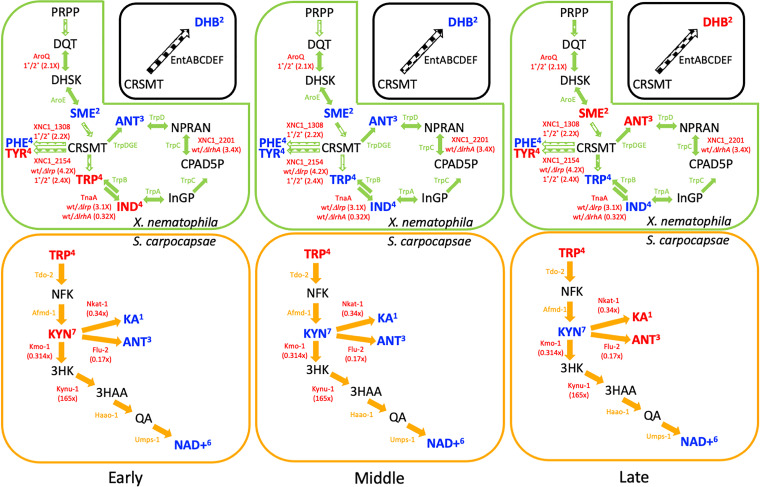
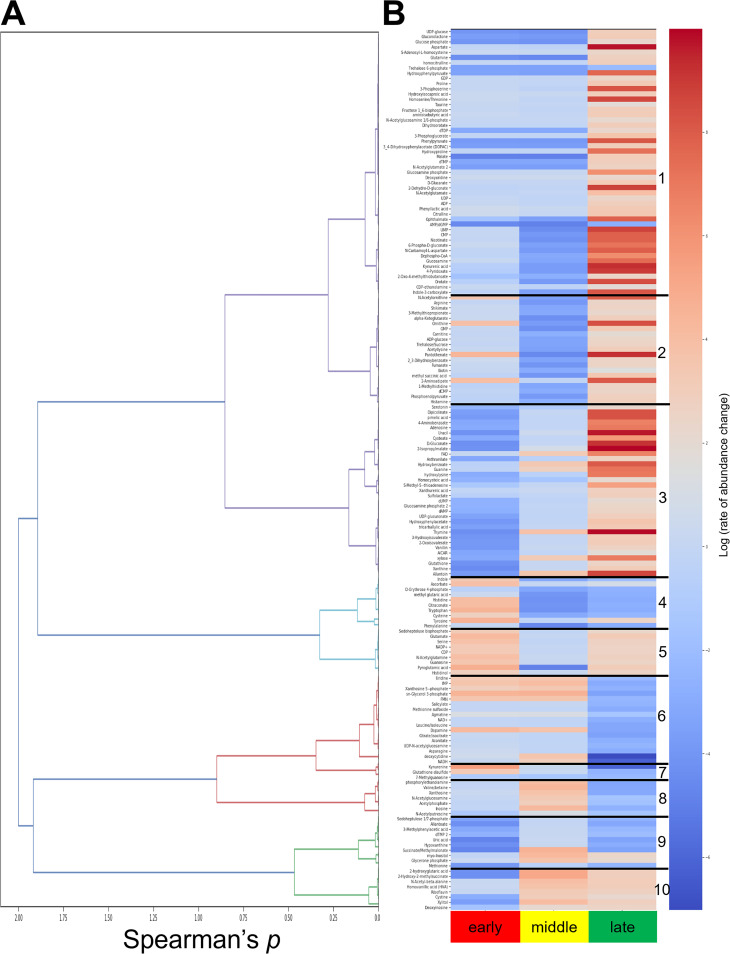
Microbial symbiosis drives physiological processes of higher-order systems, including the acquisition and consumption of nutrients that support symbiotic partner reproduction. Metabolic analytics provide new avenues to examine how chemical ecology, or the conversion of existing biomass to new forms, changes over a symbiotic life cycle. We applied these approaches to the nematode Steinernema carpocapsae, its mutualist bacterium, Xenorhabdus nematophila, and the insects they infect. The nematode-bacterium pair infects, kills, and reproduces in an insect until nutrients are depleted. To understand the conversion of insect biomass over time into either nematode or bacterium biomass, we integrated information from trophic, metabolomic, and gene regulation analyses. Trophic analysis established bacteria as meso-predators and primary insect consumers. Nematodes hold a trophic position of 4.6, indicative of an apex predator, consuming bacteria and likely other nematodes. Metabolic changes associated with Galleria mellonella insect bioconversion were assessed using multivariate statistical analyses of metabolomics data sets derived from sampling over an infection time course. Statistically significant, discrete phases were detected, indicating the insect chemical environment changes reproducibly during bioconversion. A novel hierarchical clustering method was designed to probe molecular abundance fluctuation patterns over time, revealing distinct metabolite clusters that exhibit similar abundance shifts across the time course. Composite data suggest bacterial tryptophan and nematode kynurenine pathways are coordinated for reciprocal exchange of tryptophan and NAD+ and for synthesis of intermediates that can have complex effects on bacterial phenotypes and nematode behaviors. Our analysis of pathways and metabolites reveals the chemistry underlying the recycling of organic material during carnivory. IMPORTANCE The processes by which organic life is consumed and reborn in a complex ecosystem were investigated through a multiomics approach applied to the tripartite Xenorhabdus bacterium-Steinernema nematode-Galleria insect symbiosis. Trophic analyses demonstrate the primary consumers of the insect are the bacteria, and the nematode in turn consumes the bacteria. This suggests the Steinernema-Xenorhabdus mutualism is a form of agriculture in which the nematode cultivates the bacterial food sources by inoculating them into insect hosts. Metabolomics analysis revealed a shift in biological material throughout progression of the life cycle: active infection, insect death, and conversion of cadaver tissues into bacterial biomass and nematode tissue. We show that each phase of the life cycle is metabolically distinct, with significant differences including those in the tricarboxylic acid cycle and amino acid pathways. Our findings demonstrate that symbiotic life cycles can be defined by reproducible stage-specific chemical signatures, enhancing our broad understanding of metabolic processes that underpin a three-way symbiosis.
Keywords: animal-microbe symbiosis; food web; interkingdom interactions; kynurenine; metabolomics; transcriptomics; trophic hierarchies; tryptophan.
Conflict of interest statement
The authors declare no conflict of interest.
Figures
Similar articles
-
Studying the Symbiotic Bacterium Xenorhabdus nematophila in Individual, Living Steinernema carpocapsae Nematodes Using Microfluidic Systems.mSphere. 2018 Jan 3;3(1):e00530-17. doi: 10.1128/mSphere.00530-17. eCollection 2018 Jan-Feb. mSphere. 2018. PMID: 29299529 Free PMC article.
-
High Levels of the Xenorhabdus nematophila Transcription Factor Lrp Promote Mutualism with the Steinernema carpocapsae Nematode Host.Appl Environ Microbiol. 2017 May 31;83(12):e00276-17. doi: 10.1128/AEM.00276-17. Print 2017 Jun 15. Appl Environ Microbiol. 2017. PMID: 28389546 Free PMC article.
-
Xenorhabdus nematophila bacteria shift from mutualistic to virulent Lrp-dependent phenotypes within the receptacles of Steinernema carpocapsae insect-infective stage nematodes.Environ Microbiol. 2020 Dec;22(12):5433-5449. doi: 10.1111/1462-2920.15286. Epub 2020 Nov 3. Environ Microbiol. 2020. PMID: 33078552
-
They've got a ticket to ride: Xenorhabdus nematophila-Steinernema carpocapsae symbiosis.Curr Opin Microbiol. 2007 Jun;10(3):225-30. doi: 10.1016/j.mib.2007.05.006. Epub 2007 Jun 5. Curr Opin Microbiol. 2007. PMID: 17553732 Review.
-
The bacterial symbionts of Entomopathogenic nematodes and their role in symbiosis and pathogenesis.J Invertebr Pathol. 2025 Jul;211:108295. doi: 10.1016/j.jip.2025.108295. Epub 2025 Mar 1. J Invertebr Pathol. 2025. PMID: 40032241 Review.
Cited by
-
Metabonomics reveals that entomopathogenic nematodes mediate tryptophan metabolites that kill host insects.Front Microbiol. 2022 Nov 10;13:1042145. doi: 10.3389/fmicb.2022.1042145. eCollection 2022. Front Microbiol. 2022. PMID: 36439848 Free PMC article.
-
Analyses of Xenorhabdus griffiniae genomes reveal two distinct sub-species that display intra-species variation due to prophages.BMC Genomics. 2024 Nov 15;25(1):1087. doi: 10.1186/s12864-024-10858-2. BMC Genomics. 2024. PMID: 39548374 Free PMC article.
-
OxyR is required for oxidative stress resistance of the entomopathogenic bacterium Xenorhabdus nematophila and has a minor role during the bacterial interaction with its hosts.Microbiology (Reading). 2024 Jul;170(7):001481. doi: 10.1099/mic.0.001481. Microbiology (Reading). 2024. PMID: 39058385 Free PMC article.
-
The Xenorhabdus nematophila LrhA transcriptional regulator modulates production of γ-keto-N-acyl amides with inhibitory activity against mutualistic host nematode egg hatching.Appl Environ Microbiol. 2024 Jul 24;90(7):e0052824. doi: 10.1128/aem.00528-24. Epub 2024 Jun 25. Appl Environ Microbiol. 2024. PMID: 38916293 Free PMC article.
References
-
- Margulis L. 1981. Symbiosis in cell evolution: life and its environment on the early Earth. W. H. Freeman, San Francisco, CA.
Publication types
MeSH terms
Substances
Grants and funding
LinkOut - more resources
Full Text Sources
Miscellaneous
