. 2022 May;130(5):57001.
doi: 10.1289/EHP9009. Epub 2022 May 11.

Evaluation of a Gene-Environment Interaction of PON1 and Low-Level Nerve Agent Exposure with Gulf War Illness: A Prevalence Case-Control Study Drawn from the U.S. Military Health Survey's National Population Sample

Affiliations

Evaluation of a Gene-Environment Interaction of PON1 and Low-Level Nerve Agent Exposure with Gulf War Illness: A Prevalence Case-Control Study Drawn from the U.S. Military Health Survey's National Population Sample

Robert W Haley et al. Environ Health Perspect. 2022 May.

Abstract

Background: Consensus on the etiology of 1991 Gulf War illness (GWI) has been limited by lack of objective individual-level environmental exposure information and assumed recall bias.

Objectives: We investigated a prestated hypothesis of the association of GWI with a gene-environment (GxE) interaction of the paraoxonase-1 (PON1) Q192R polymorphism and low-level nerve agent exposure.

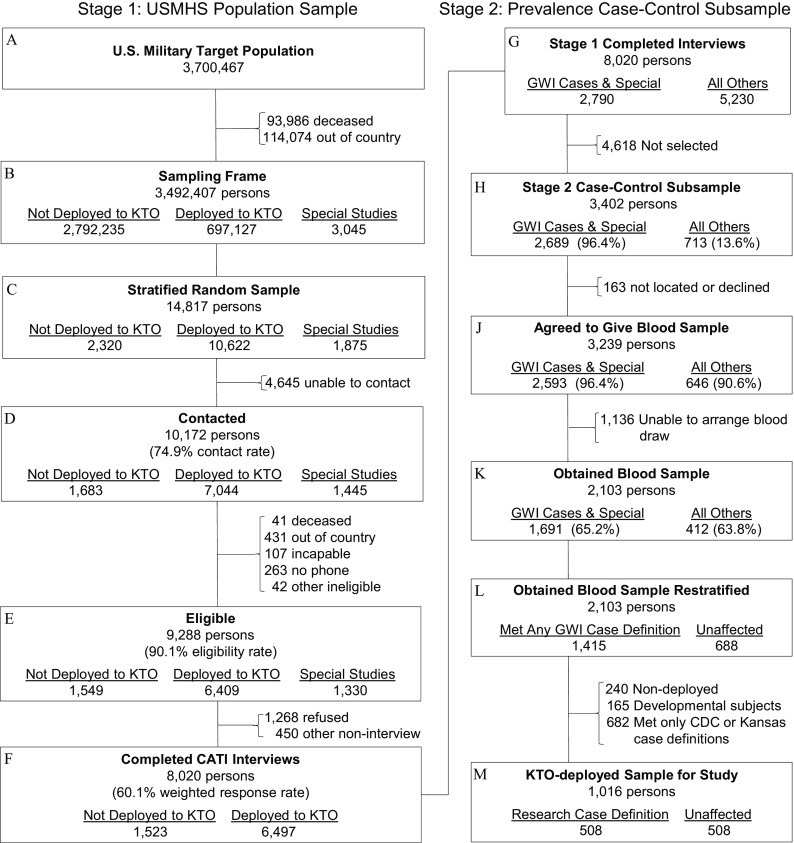
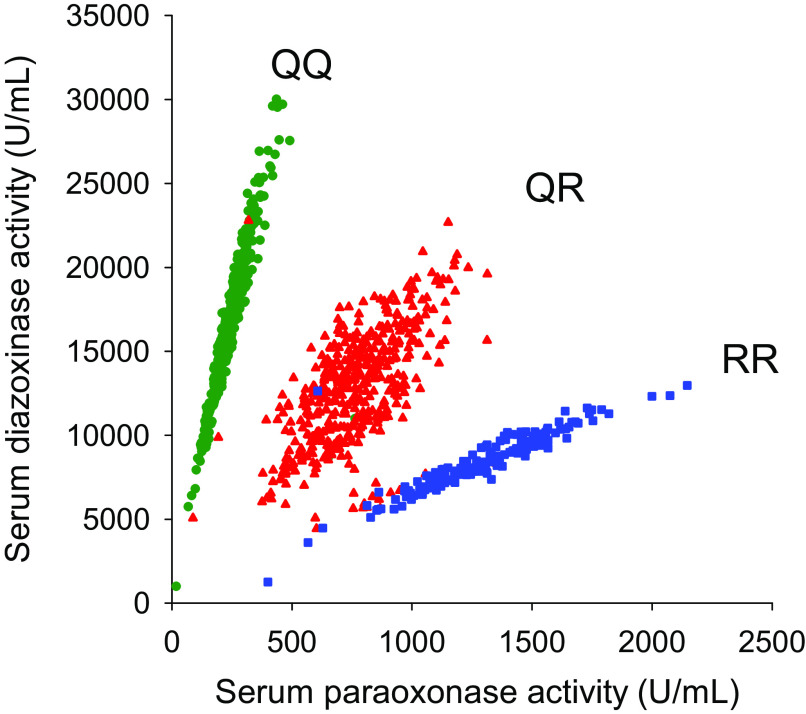
Methods: A prevalence sample of 508 GWI cases and 508 nonpaired controls was drawn from the 8,020 participants in the U.S. Military Health Survey, a representative sample survey of military veterans who served during the Gulf War. The PON1 Q192R genotype was measured by real-time polymerase chain reaction (RT-PCR), and the serum Q and R isoenzyme activity levels were measured with PON1-specific substrates. Low-level nerve agent exposure was estimated by survey questions on having heard nerve agent alarms during deployment.

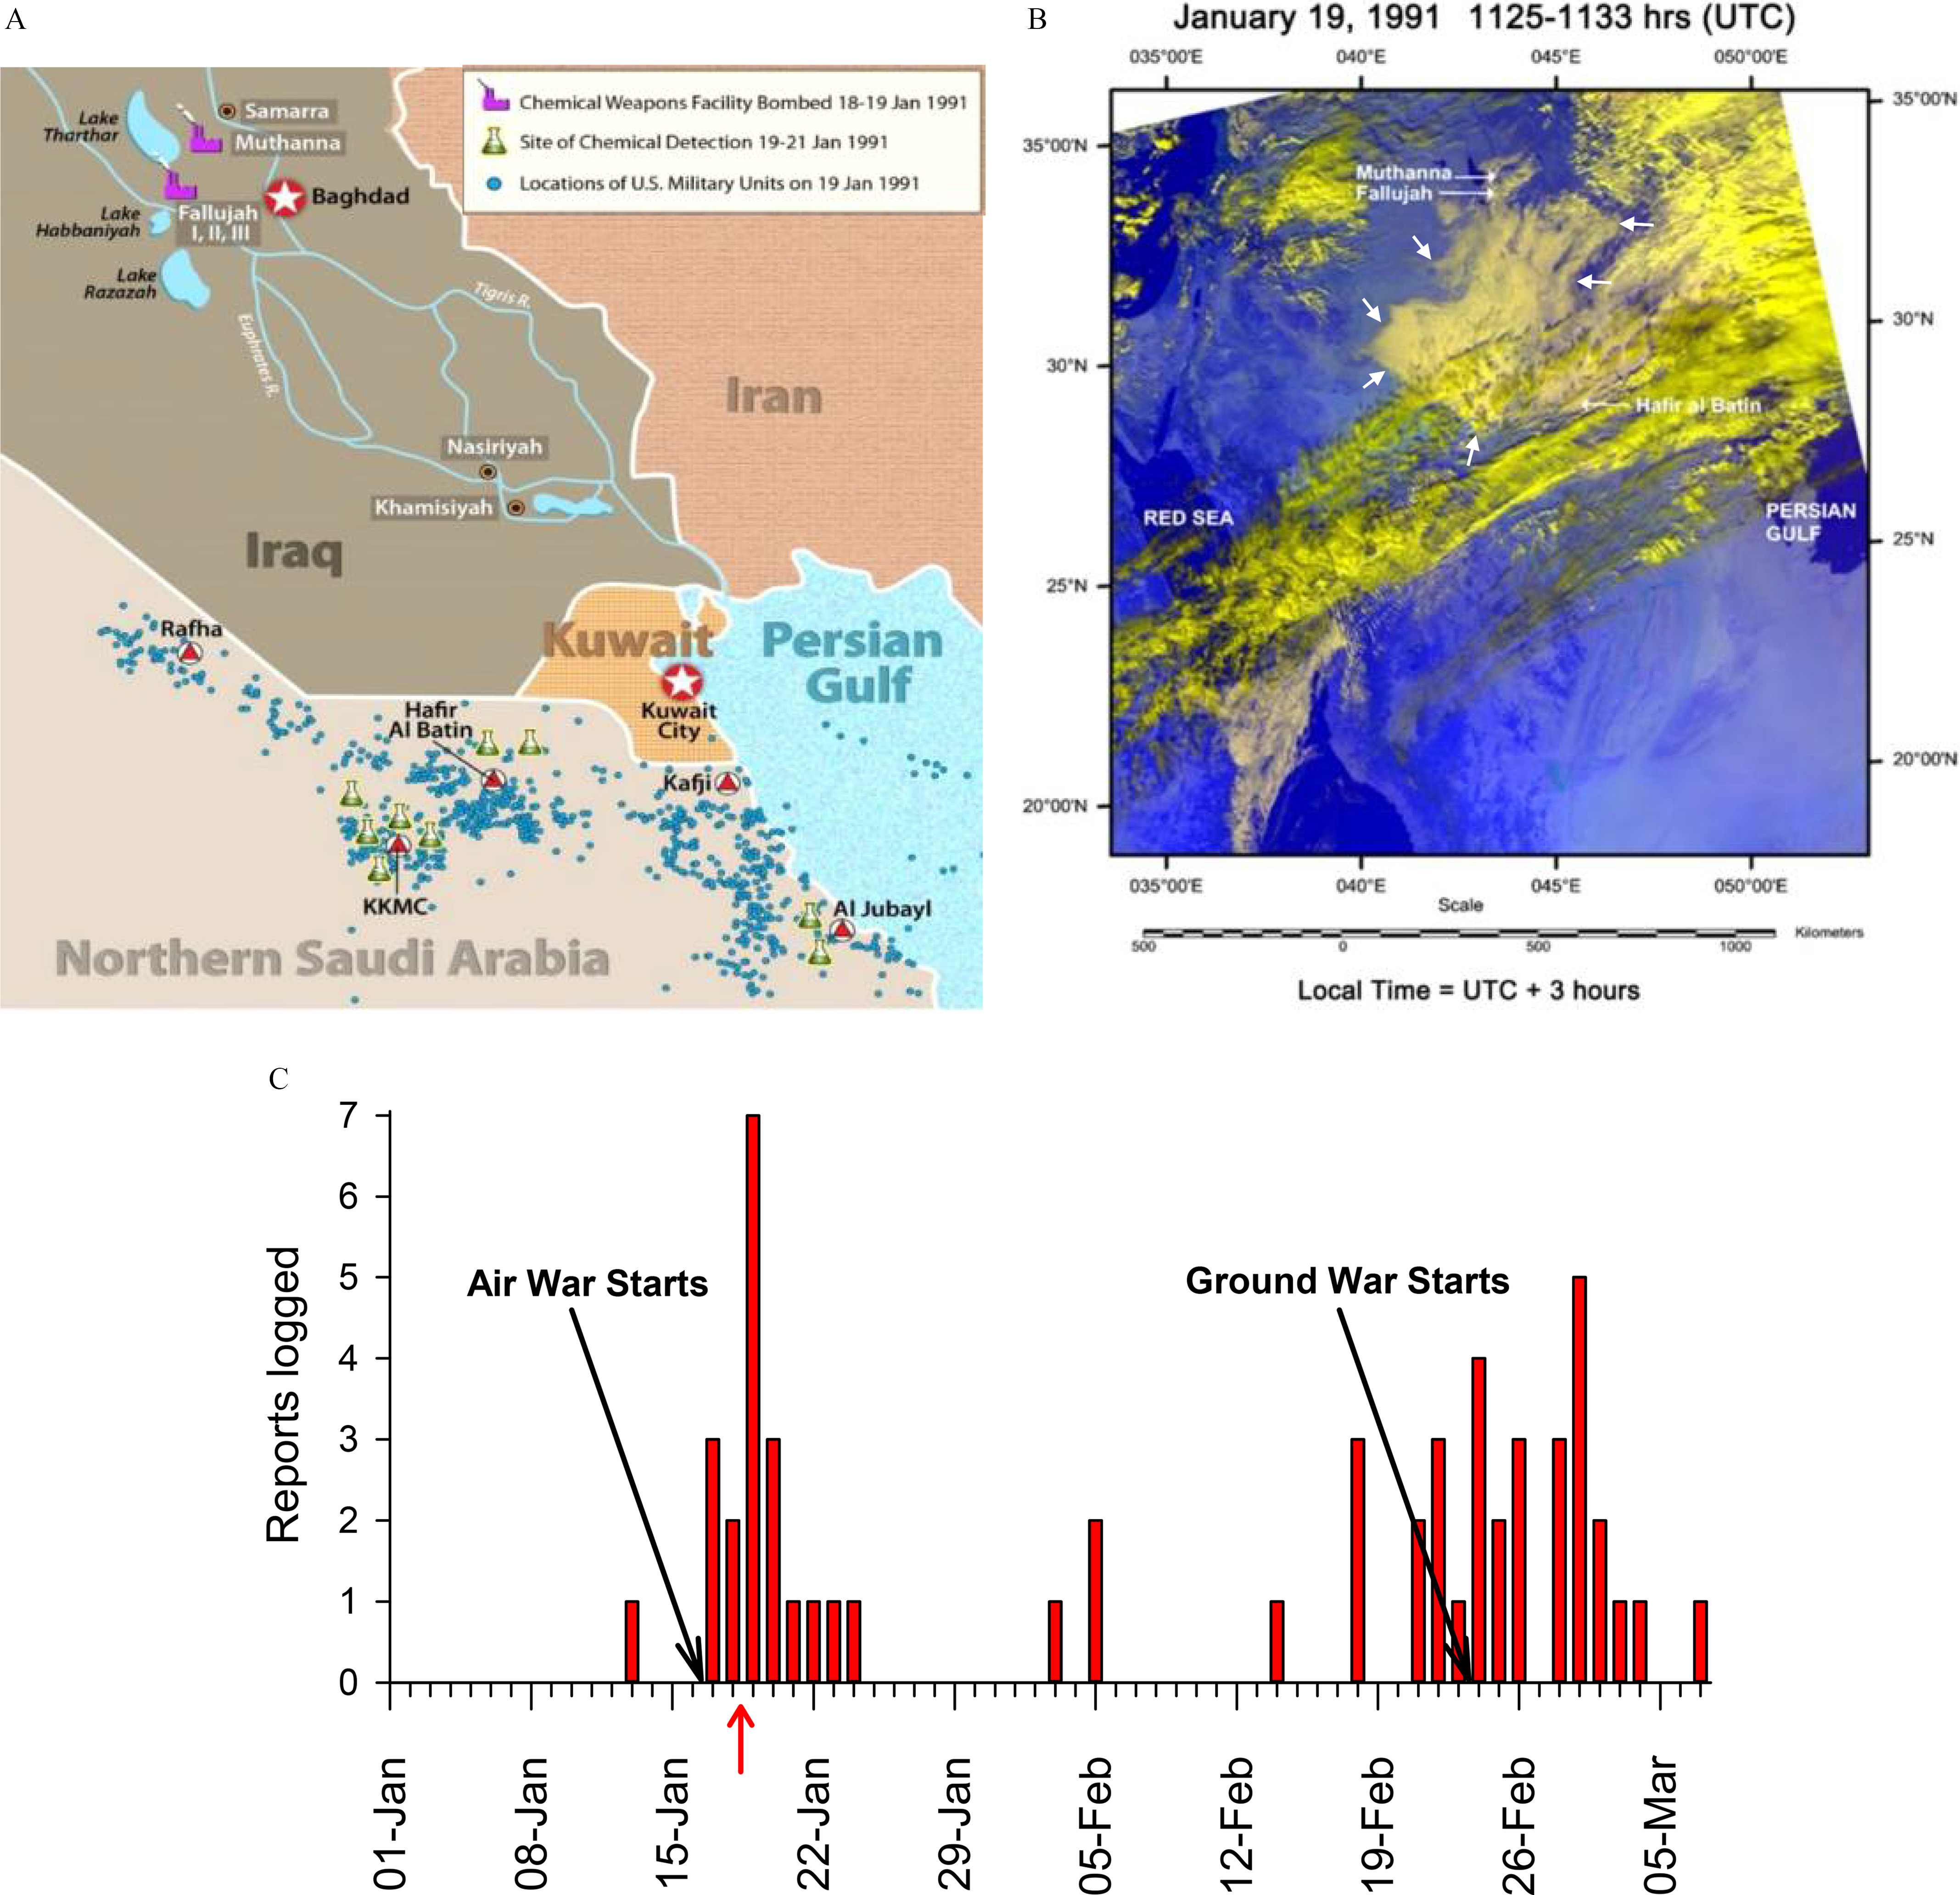
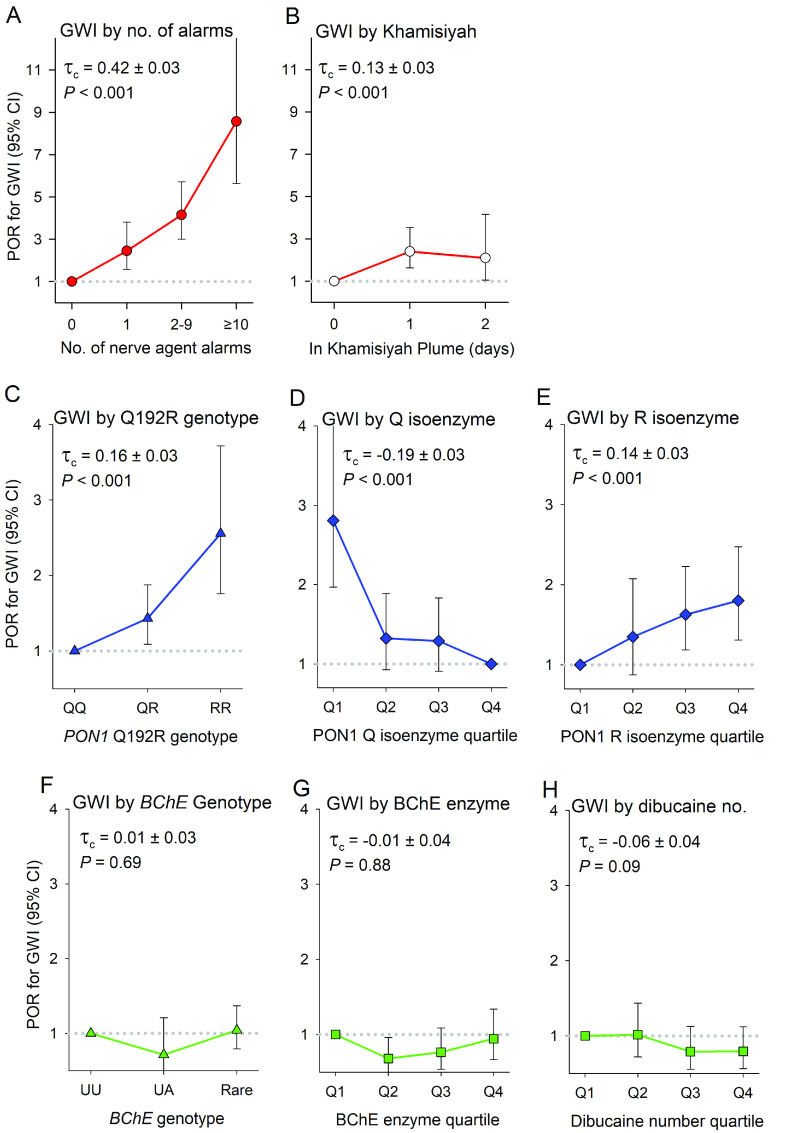
Results: The GxE interaction of the Q192R genotype and hearing alarms was strongly associated with GWI on both the multiplicative [prevalence odds ratio (POR) of the interaction=3.41; 95% confidence interval (CI): 1.20, 9.72] and additive (synergy index=4.71; 95% CI: 1.82, 12.19) scales, adjusted for measured confounders. The Q192R genotype and the alarms variable were independent (adjusted POR in the controls=1.18; 95% CI: 0.81, 1.73; p=0.35), and the associations of GWI with the number of R alleles and quartiles of Q isoenzyme were monotonic. The adjusted relative excess risk due to interaction (aRERI) was 7.69 (95% CI: 2.71, 19.13). Substituting Q isoenzyme activity for the genotype in the analyses corroborated the findings. Sensitivity analyses suggested that recall bias had forced the estimate of the GxE interaction toward the null and that unmeasured confounding is unlikely to account for the findings. We found a GxE interaction involving the Q-correlated PON1 diazoxonase activity and a weak possible GxE involving the Khamisiyah plume model, but none involving the PON1 R isoenzyme activity, arylesterase activity, paraoxonase activity, butyrylcholinesterase genotypes or enzyme activity, or pyridostigmine.

Discussion: Given gene-environment independence and monotonicity, the unconfounded aRERI>0 supports a mechanistic interaction. Together with the direct evidence of exposure to fallout from bombing of chemical weapon storage facilities and the extensive toxicologic evidence of biochemical protection from organophosphates by the Q isoenzyme, the findings provide strong evidence for an etiologic role of low-level nerve agent in GWI. https://doi.org/10.1289/EHP9009.


Figures

Figure 1 is a set of two flowcharts titled Stage 1: U S M H S population sample and Stage 2: Prevalence Case-Control Subsample. Stage 1 has six steps. Step A: 3700467 United States Military Target Population in which 93986 are deceased and 114074 are out of country. Step B: 3492407 persons under sampling frame, including 2792235 persons in not deployed to K T O, 697127 persons deployed to K T O, and 3045 persons in Special Studies. Step C: 14817 persons under stratified random sample, including 2320 persons are not deployed to K T O, 10622 persons are deployed to K T O, and 1875 persons are in Special Studies. Step D: 10172 persons contacted with 74.9 percent contact rate, including 1683 persons are not deployed to K T O, 7044 persons are deployed to K T O, and 1445 persons are Special Studies. Step E: 9288 persons are Eligible with 90.1 percent eligibility rate, including 1549 persons are not deployed to K T O, 6409 persons are deployed to K T O, and 1330 persons are Special Studies. Step F: 8020 persons have completed C A T I interview with 60.1 percent weighted response rate, including 1523 not deployed to K T O and 6497 are deployed to K T O. Stage 2 has six steps. Step G: 8020 persons have completed stage 1 interviews, including 2790 persons are under G W I cases and special and 5230 persons are under all others. Step H: 3402 persons have under stage 2 case control subsample, including 2689 persons are under G W I cases and special with 96.4 percent and 713 persons are under all others with 13.6 percent. 163 persons are not located or declined. Stage J: 3239 have agreed to give blood sample, 2593 persons are under G W I cases and special with 96.4 percent and 646 persons are under all others with 90.6 percent. Step K: 2103 persons obtained blood sample, including 1691 persons are under G W I cases and special with 65.2 percent and 412 persons are under all others with 63.8 percent. Step L: 2103 persons obtained blood sample restratified, including 1415 met any G W I case definition and 698 unaffected in which 240 persons are not deployed, 165 persons are developmental subjects, and 682 persons met only C D C or Kansas case definitions. Step M: 1016 persons are K T O deployed sample for study, including 508 persons are unaffected.
Figure 1.
Selection of the stage 1 USMHS population sample and the stage 2 prevalence case–control subsample. (A) Includes all U.S. military personnel on active duty or in the Reserves or National Guard on 2 August 1990. (B) Those not deployed to the Kuwaiti Theater of Operations (KTO) included medically nondeployable personnel. “Special Studies” included twins, members of the 24th Reserve Naval Mobile Construction Battalion (Seabees), and parents of children with Goldenhar Complex. Counts for subgroups are suppressed to maintain confidentiality according to terms of the Certificate of Confidentiality. (C) The sampling frame was stratified by age, sex, race, service branch, military rank, active duty/reserve status, special studies strata, and KTO location on 20 January 1991. (D) The denominator of the survey-weighted contact rate includes the number of known survey-eligible persons and the estimated number of eligible persons among those with an undetermined survey eligibility status. (E) The eligibility rate was calculated with survey weights applied among sample members with known survey eligibility. (F) The survey-weighted response rate is the American Association for Public Opinion Research’s Response Rate 4 (RR4), calculated as the number of confirmed and estimated eligible cases among those initially selected for the CATI phase of the study. (G) The universe for the current prevalence case–control study includes all subjects in (F). (H) In selecting the prevalence case–control sample, the CATI algorithm selected all GWI cases by the Research and Kansas case definitions and a 12.5% random sample of the rest of the USMHS participants. The slight deviations from these selection percentages resulted from late adjustments in the CATI algorithm. (L) Veterans who met any GWI case definition specifically met the GWI Research, CDC, or Kansas (without exclusions) case definitions. The 165 developmental subjects excluded after (L) were those from the Seabees battalion who participated in the initial study to develop the GWI Research case definition. (M) To minimize misclassification, the 508 who met the GWI Research case definition—a close subset of the CDC and Modified Kansas definitions—were separated from those meeting only the CDC or Modified Kansas definitions and were used as cases in the prevalence case-control study. Unaffected subjects, those meeting none of the three GWI case definitions, constituted the controls in the prevalence case–control study. The left-hand column (A–F) of the figure was adapted from the original USMHS sampling flowchart published in Iannacchione et al. Note: CATI, computer-assisted telephone interview; CDC, U.S. Centers for Disease Control and Prevention; GWI, Gulf War Illness; USMHS, U.S. Military Health Survey.
Figure 2A is a map of Kuwaiti Theater of Operations depicting the locations of major chemical weapons storage facilities which were bombed on 18 and 19 January, 1991; sites of sarin and other chemical weapon detections on 19 to 21 January, 1991; and location of United States military units on 19 January, 1991. Figure 2B is a weather satellite image of the large debris cloud taken on 19 January 1991, depicting Muthanna, Fallujah, Hafir Al Batin, Red Sea, and Persian Gulf. Figure 2C is a bar graph, plotting Reports logged, ranging from 0 to 7 in unit increments (y-axis) and dates, including, 01 January, 08 January, 15 January, 22 January, 29 January, 05 February, 12 February, 19 February, 26 February, and 05 March (x-axis) for Air war starts and Ground war starts.
Figure 2.
(A) Map of the Kuwaiti Theater of Operations (KTO) showing the locations of major chemical weapons storage facilities bombed on the night of 18–19 January and location of U.S. military units and sites of sarin and other chemical weapon detections on 19–21 January. (B) Weather satellite image of the large debris cloud (light tan in color and demarcated by white arrows) containing dispersed chemical weapon vapor. Sequential images from every-2-h passes showed the debris rising from the bombed chemical weapons storage facilities at Muthanna and Fallujah and drifting southward to encompass U.S. troop positions. This image was taken at approximately 14:30 h local time on 19 January showing the debris reaching Hafir Al Batin, the day 10,000 nerve agent alarms began sounding and chemical weapons experts using sophisticated equipment detected ambient sarin and other agents at multiple sites across U.S. positions., The light green cloud bank extending from northeast to southwest indicated a stationary weather front that held the sarin-containing debris cloud over U.S. troop positions for a week. (C) Numbers of reports of alarms, warnings, etc., logged within the Nuclear, Biological, and Chemical cells of the Central Command, Army Central Command, and VII Army Corps during the Conflict Period of the Gulf War; the red vertical arrow marks the night of 18–19 January just before the satellite image in (B) was taken. Figures (A) and (B) reproduced from Neuroepidemiology by permission of S. Karger AG, Basel, and (C) from the June 1994 report of the Defense Science Board Task Force on Persian Gulf War Health Effects.
Figure 3 is a dot graph, plotting Serum diazoxonase activity (Units per milliliter), ranging from 0 to 35000 in increments of 5000 (y-axis) across Serum paraoxonase activity (Units per milliliter), ranging from 0 to 2500 in increments of 500 (x-axis) for uppercase q q, uppercase q r, and uppercase r r.
Figure 3.
Classification of the 1,016 Gulf War-era veterans of the prevalence case-control sample into the three PON1 Q192R phenotypes (QQ, QR, and RR) by their serum hydrolytic activity for substrates diazoxon (“diazoxonase activity”) and paraoxon (“paraoxonase activity”). QQ subjects have only the Q isoenzyme (green circles); RR subjects have only the R isoenzyme (blue squares); and the QR subjects have some of each (red triangles). The relative amounts of the Q and R isoenzymes in each QR subject is estimated by an interpolation equation.,
Figures 4A to 4H are line graphs titled Gulf War illness by number of alarms, Gulf War illness by Khamisiyah, Gulf War illness by 192 glutamine (Q) isoenzyme or the 192 arginine (R) isoenzyme genotype, Gulf War illness by Q isoenzyme, Gulf War illness by R isoenzyme, Gulf War illness by serum butyrylcholinesterase activity genotype, Gulf War illness by serum butyrylcholinesterase activity enzyme, and Gulf War illness by dibucaine number, plotting prevalence odds ratio for Gulf War illness (95 percent confidence intervals), ranging from 1 to 4 in unit increments (y-axis) across Number of nerve agent alarms, ranging as 0, 1, 2 to 9, and greater than or equal to 10; In Khamisiyah Plume (days), ranging from 0 to 2 in unit increments; Paraoxonase-1 192 glutamine (Q) isoenzyme or the 192 arginine (R) isoenzyme genotype, including Uppercase q q, Uppercase q r, and Uppercase r r; type Q Paraoxonase-1 isoenzyme quartile, including quartile 1, quartile 2, quartile 3, and quartile 4; type Q Paraoxonase-1 isoenzyme quartile, including quartile 1, quartile 2, quartile 3, and quartile 4; butyrylcholinesterase activity genotype, including uppercase u u, uppercase u a, and rare; butyrylcholinesterase activity enzyme, including quartile 1, quartile 2, quartile 3, and quartile 4; and Dibucaine number quartile, including quartile 1, quartile 2, quartile 3, and quartile 4 (x-axis) for lowercase tau and uppercase italic p, respectively.
Figure 4.
The association of measures of low-level nerve agent exposure and genetic predisposition with Gulf War Illness. The measures are (A) the number of times veterans were possibly exposed to low-level nerve agent indicated by nerve agent alarms sounding where they were present; (B) the number of days veterans were in an area exposed to a possible plume of low-level nerve agent from postwar demolition of artillery shells containing sarin and cyclosarin in the Khamisiyah ammunition dump according to U.S. government computer modeling; (C) the PON1 Q192R genotype; (D) serum PON1 192Q isoenzyme activity; (E) serum PON1 192R isoenzyme activity; (F) the BChE genotype; (G) serum BChE enzyme activity; and (H) dibucaine number. Statistics are unadjusted. Note: BChE, serum butyrylcholinesterase activity; CI, confidence interval; GWI, Gulf War Illness; POR, prevalence odds ratio; τc, Stuart and Kendall’s tau-c nonparametric correlation coefficient and its asymptotic standard error testing monotonicity; P, two-tailed significance test of τc=0. The numerical values for the graphs are given in Table S5.

Comment in

References

    1. Institute of Medicine (US) Committee on Measuring the Health of Persian Gulf Veterans. 1999. Gulf War Veterans: Measuring Health. Hernandez LM, Durch JS, Blazer DG II, Hoverman IV, eds. Washington, DC: National Academies Press. PMID: , 10.17226/9636. - DOI - PubMed
    1. Haley RW, Kurt TL, Hom J. 1997. Is there a Gulf war syndrome? Searching for syndromes by factor analysis of symptoms. JAMA 277(3):215–222, PMID: , 10.1001/jama.1997.03540270041025. - DOI - PubMed
    1. Fukuda K, Nisenbaum R, Stewart G, Thompson WW, Robin L, Washko RM, et al. 1998. Chronic multisymptom illness affecting air force veterans of the Gulf war. J Am Med Assoc 280(11):981–988, PMID: , 10.1001/jama.280.11.981. - DOI - PubMed
    1. Steele L. 2000. Prevalence and patterns of Gulf war illness in Kansas veterans: association of symptoms with characteristics of person, place, and time of military service. Am J Epidemiol 152(10):992–1002, PMID: , 10.1093/aje/152.10.992. - DOI - PubMed
    1. Institute of Medicine. 2010. Gulf War and Health, Vol. 8: Update of Health Effects of Serving in the Gulf War. Washington, DC: National Academies Press. PMID: , 10.17226/12835. - DOI - PubMed

Publication types

LinkOut - more resources