. 2022 Dec 1;163(12):2326-2336.
doi: 10.1097/j.pain.0000000000002680. Epub 2022 May 11.

Automated preclinical detection of mechanical pain hypersensitivity and analgesia

Affiliations

Automated preclinical detection of mechanical pain hypersensitivity and analgesia

Zihe Zhang et al. Pain. .

Abstract

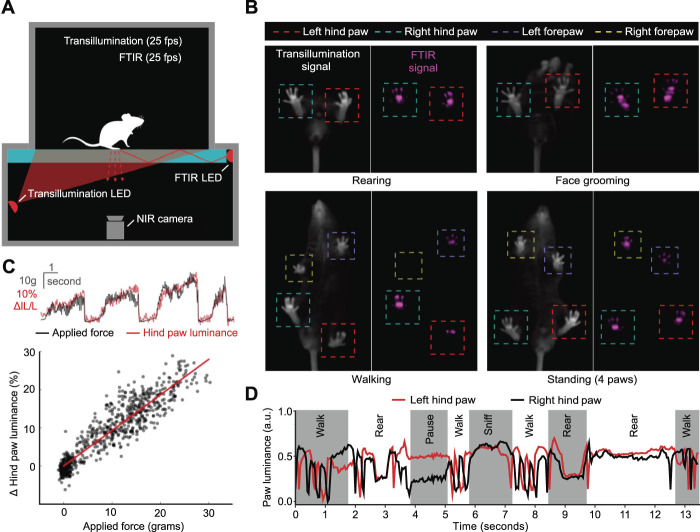
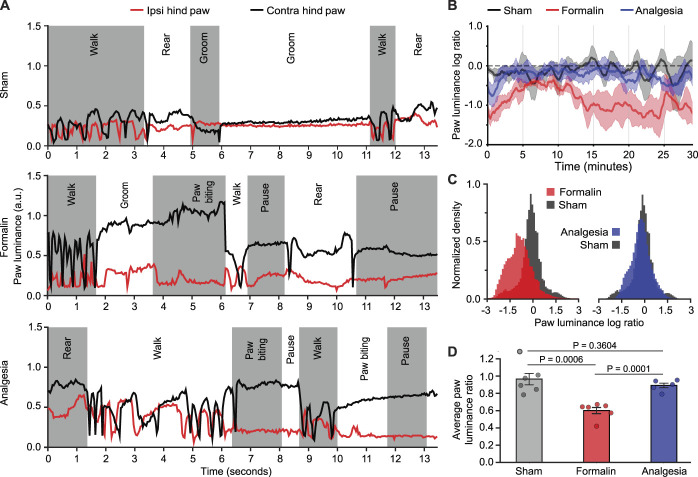
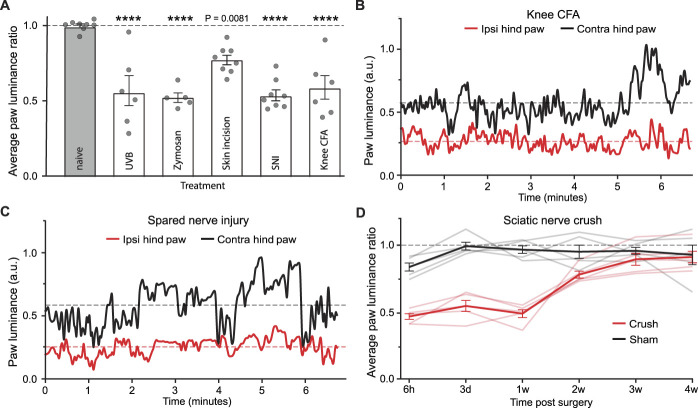
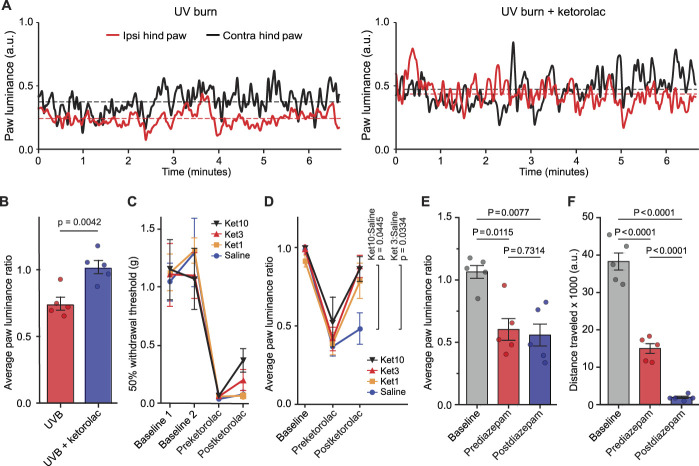
The lack of sensitive and robust behavioral assessments of pain in preclinical models has been a major limitation for both pain research and the development of novel analgesics. Here, we demonstrate a novel data acquisition and analysis platform that provides automated, quantitative, and objective measures of naturalistic rodent behavior in an observer-independent and unbiased fashion. The technology records freely behaving mice, in the dark, over extended periods for continuous acquisition of 2 parallel video data streams: (1) near-infrared frustrated total internal reflection for detecting the degree, force, and timing of surface contact and (2) simultaneous ongoing video graphing of whole-body pose. Using machine vision and machine learning, we automatically extract and quantify behavioral features from these data to reveal moment-by-moment changes that capture the internal pain state of rodents in multiple pain models. We show that these voluntary pain-related behaviors are reversible by analgesics and that analgesia can be automatically and objectively differentiated from sedation. Finally, we used this approach to generate a paw luminance ratio measure that is sensitive in capturing dynamic mechanical hypersensitivity over a period and scalable for high-throughput preclinical analgesic efficacy assessment.


Conflict of interest statement

D. P. Roberson, C. J. Woolf, A. B. Wiltschko, L. B. Barrett, and S. R. Datta have issued patents on the data acquisition technology. D. P. Roberson, L. B. Barrett, and C. J. Woolf have a financial relationship with Blackbox Bio, the company which has licensed the patent on the technology from Boston Children's Hospital. D. P. Roberson is also now an employee of Blackbox Bio.

Sponsorships or competing interests that may be relevant to content are disclosed at the end of this article.

Figures

Figure 1.
Figure 1.
Bottom-up freely moving behavioral assessment system. (A) Schematic of recording device illustrating NIR transillumination and FTIR, captured using a single NIR camera, each at 25 fps. (B) Representative frames from transilluminated (body frame) and FTIR channels. FTIR signal captures subtle footprint patterns of freely moving mice. (C) Relationship between normalized hind paw FTIR luminance signal (red) and force applied to a paw (black). Scatterplot demonstrates linear relationship (R2 = 0.85) between force and luminance over a physiologically relevant range, and data points represent individual force transducer application in a single mouse. (D) Demonstration of dynamic FTIR luminance signals (25 fps) for each hind paw during different naturalistic behaviors. Paw luminance signals are scaled (min-95 quantile) and are shown in arbitrary unit (a.u). fps, frames per second; FTIR, frustrated total internal reflection; NIR, near-infrared.
Figure 2.
Figure 2.
FTIR paw luminance signals capture pain-related and analgesia-related changes in the intraplantar formalin model. (A) Example of scaled (min-95 quantile) paw luminance signals of ipsilateral (red) and contralateral hind paw (black) of mice from sham (intraplantar saline) (top), formalin (middle), and morphine analgesia groups (3 mg/kg subcutaneous injection, bottom) during different behaviors. (B) Logarithm of paw luminance ratio (calculated as logarithmic(luminanceipsilateral-pawluminancecontralateral-paw), log ratio) over the 30 minutes after intraplantar formalin/saline injection (n = 6, 6, and 5 for sham, formalin, and analgesia groups). (C) Density histograms of paw luminance log ratio over a 30-minute recording of mice from sham (black, n = 6), formalin (red, n = 6), and analgesia groups (blue, n = 5). Formalin reduced the log ratio, and this was returned to control levels by morphine. (D) Average paw luminance ratio over a 30-min recording of mice in the 3 groups (n = 6, 6, and 5) detected both the mechanical pain hypersensitivity induced by formalin and the analgesic efficacy of morphine. Shading in panel (B) indicates 95% confidence interval as mean ± 1.96 × SEM. Data in panel (D) presented as mean ± SEM. Statistical significance for panel D determined by the 2-tail unpaired Student t test. FTIR, frustrated total internal reflection.
Figure 3.
Figure 3.
Paw luminance measurements in multiple unilateral pain models. (A) Average paw luminance ratios over 10 minutes for untreated mice (naive, n = 8), after ultraviolet radiation burn (48 hours after injury, n = 6), local pathogen-induced inflammation (zymosan, 4 hours after injury, n = 5), traumatic injury (skin incision, 1 hour after injury, n = 8), neuropathic pain (SNI, n = 8, 8 weeks after injury), and joint inflammation (knee CFA, n = 6, 3 days after injury). (****P < 0.0001). (B) Example of scaled (min-95 quantile) paw luminance signals of both ipsilateral (red) and contralateral hind paws (black) of a mouse with knee CFA-induced inflammation. (C) Example of scaled (min-95 quantile) paw luminance signals of a mouse from the SNI model at 8 weeks after surgery. (D) Average paw luminance ratio over 20-minute recording captures functional recovery in 4 weeks after SNc (crush, red, n = 5), compared with the sham group (black, n = 5). The measures of individual mice are shown as shaded lines. Data in panel A and D presented as mean ± SEM. Statistical significance for panel A determined by the Dunnett multiple comparison test and in D by the 2-tail unpaired Student t test. CFA, complete Freund adjuvant; SNc, sciatic nerve crush; SNI, spared nerve injury; UVB, ultraviolet radiation burn.
Figure 4.
Figure 4.
Average paw luminance ratio evaluation of analgesia in the inflammatory pain model. (A) Paw luminance signals of an individual animal show mechanical hypersensitivity in the injured paw (left hind paw) induced by UVB (left panel) detected by reduced luminescence and increased luminescence as a measure of the analgesic effect of ketorolac (10 mg/kg, right panel). (B) Ketorolac 10 mg/kg recovered the average paw luminance ratio in UVB mice to control (ratio = 1) levels (n = 5 for each group). (C) Effect of ketorolac (1 mg/kg, 3 mg/kg, 10 mg/kg, and saline control; n = 5 for each group) on von Frey mechanical thresholds and (D) on the average paw luminance ratio. Baseline readouts were conducted before zymosan injection, the “pre” readouts were 4 hours after zymosan injection but before ketorolac administration, and the “post” were 1 hour after ketorolac administration. For the average paw luminance ratio, a significant reversal from saline levels was detected after 3 and 10 mg/kg ketorolac treatment. (E) Average paw luminance ratio and (F) total distance traveled (in pixel unit) and for 10-minute recordings, baseline readouts were conducted before zymosan injection, the “pre” readouts were 4 hours after zymosan injection but before diazepam administration, and the “post” were 30 minutes after diazepam. Data in panel (B), (C), (D), (E), and (F) presented as mean ± SEM. Statistical significance for panel (B) determined by the 2-tail unpaired Student t-test; for (C) and (D) by 2-way ANOVA repeated measures, followed by the Dunnett post hoc analysis; and for (E) and (F) by the paired Student t-test. UVB, ultraviolet radiation burn.

References

    1. Abbott FV, Franklin KBJ, Westbrook RF. The formalin test: scoring properties of the first and second phases of the pain response in rats. PAIN 1995;60:91–102. - PubMed
    1. Abdus-Saboor I, Fried NT, Lay M, Burdge J, Swanson K, Fischer R, Jones J, Dong P, Cai W, Guo X, Tao Y-X, Bethea J, Ma M, Dong X, Ding L, Luo W. Development of a mouse pain scale using sub-second behavioral mapping and statistical modeling. Cell Rep 2019;28:1623–34. - PMC - PubMed
    1. Berridge KC, Whishaw IQ. Cortex, striatum and cerebellum: control of serial order in a grooming sequence. Exp Brain Res 1992;90:275–90. - PubMed
    1. Berryman ER, Harris RL, Moalli M, Bagi CM. DigigaitTM quantitation of gait dynamics in rat rheumatoid arthritis model. J Musculoskelet Neuronal Interact 2009;9:89–98. - PubMed
    1. Bester H, Beggs S, Woolf CJ. Changes in tactile stimuli-induced behavior and c-Fos expression in the superficial dorsal horn and in parabrachial nuclei after sciatic nerve crush. J Comp Neurol 2000;428:45–61. - PubMed

Publication types