Clinical Trial
. 2022 Mar;3(3):e203-e214.
doi: 10.1016/S2666-5247(21)00239-1. Epub 2022 Jan 24.

Effect of 3BNC117 and romidepsin on the HIV-1 reservoir in people taking suppressive antiretroviral therapy (ROADMAP): a randomised, open-label, phase 2A trial

Affiliations
Clinical Trial

Effect of 3BNC117 and romidepsin on the HIV-1 reservoir in people taking suppressive antiretroviral therapy (ROADMAP): a randomised, open-label, phase 2A trial

Henning Gruell et al. Lancet Microbe. 2022 Mar.

Abstract

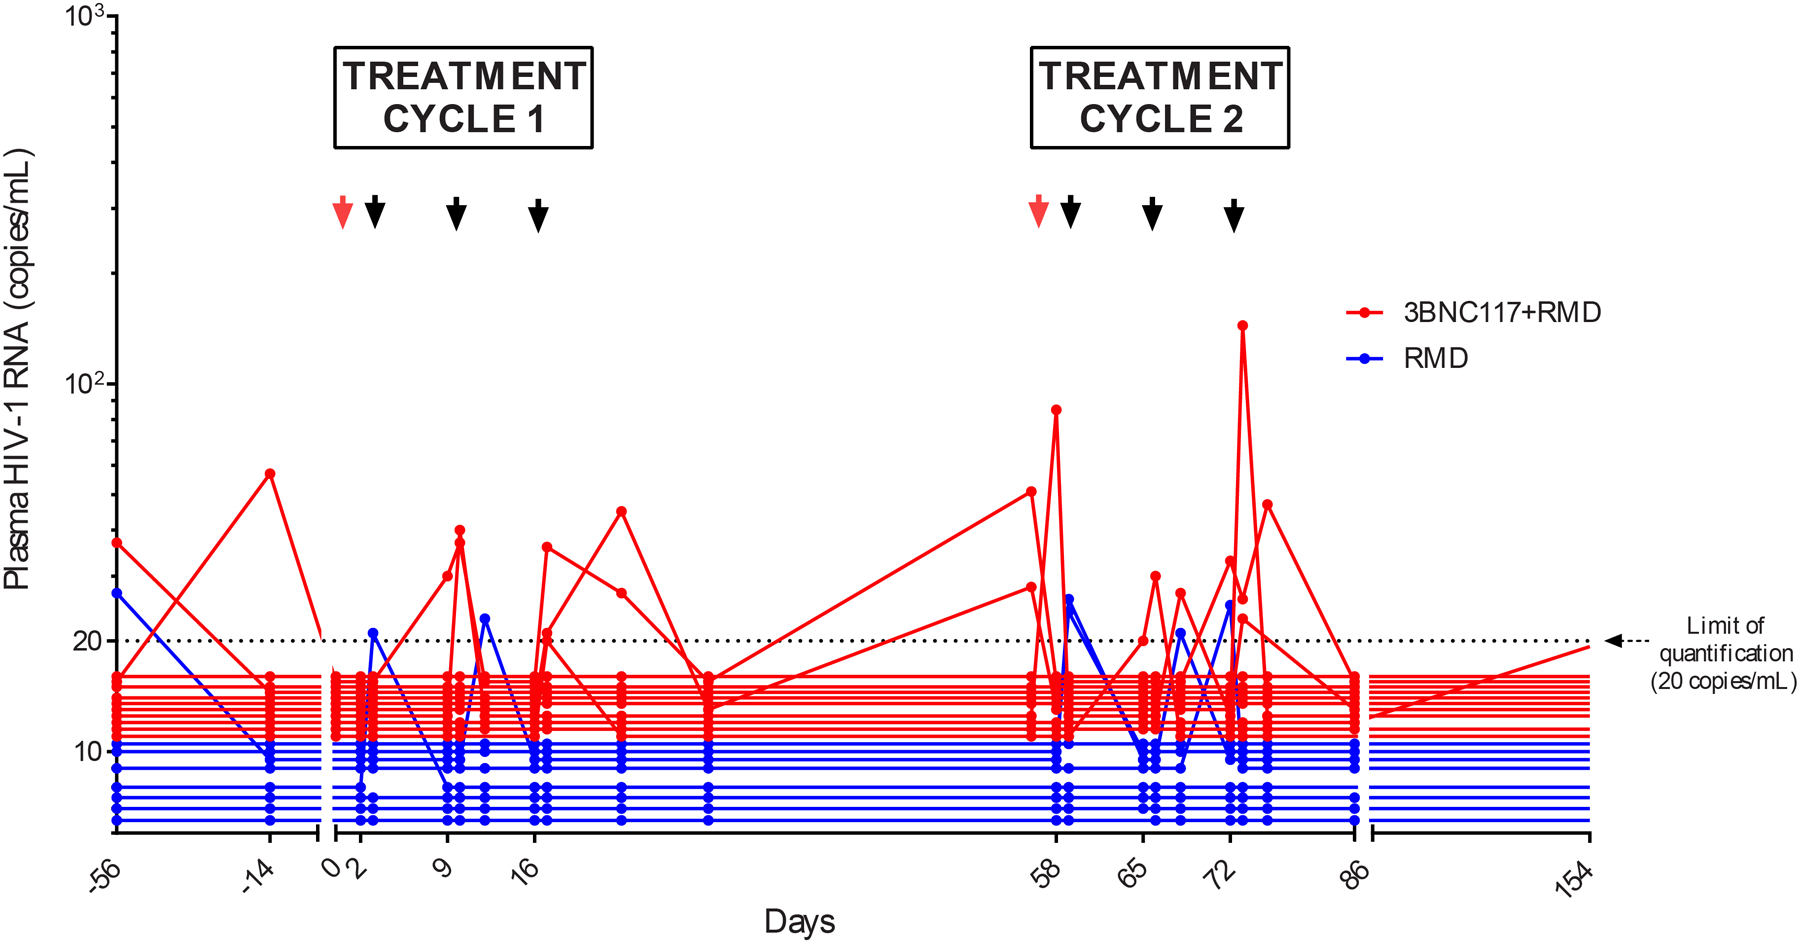
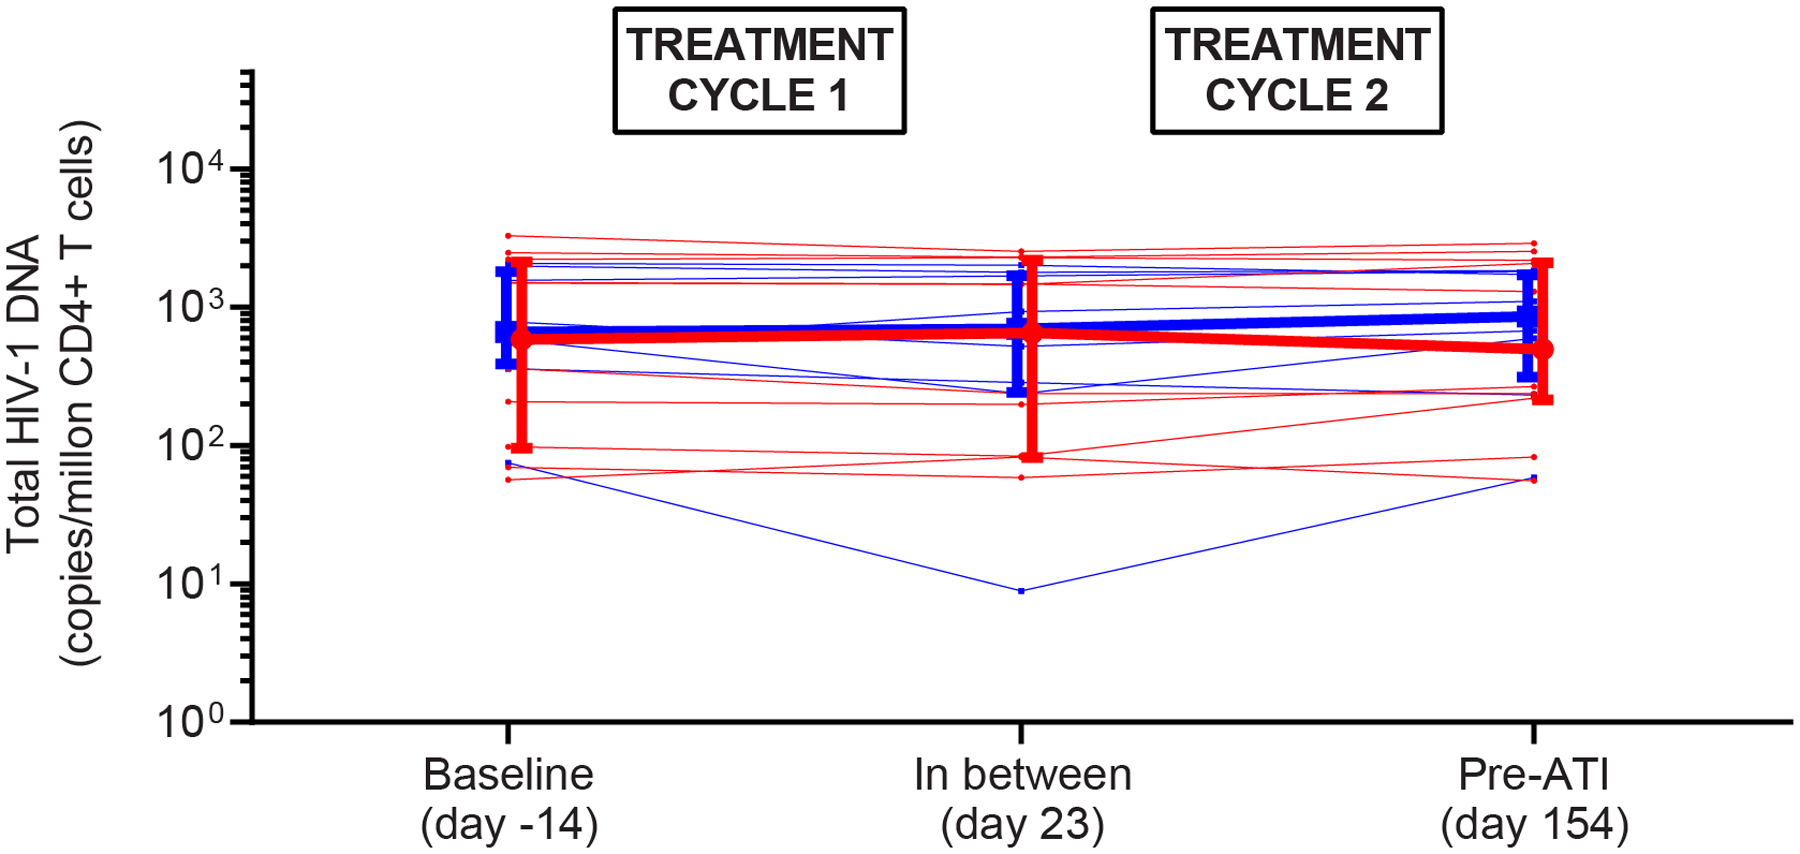
Background: The administration of broadly neutralising anti-HIV-1 antibodies before latency reversal could facilitate elimination of HIV-1-infected CD4 T cells. We tested this concept by combining the broadly neutralising antibody 3BNC117 in combination with the latency-reversing agent romidepsin in people with HIV-1 who were taking suppressive antiretroviral therapy (ART).

Methods: We did a randomised, open-label, phase 2A trial at three university hospital centres in Denmark, Germany, and the USA. Eligible participants were virologically suppressed adults aged 18-65 years who were infected with HIV-1 and on ART for at least 18 months, with plasma HIV-1 RNA concentrations of less than 50 copies per mL for at least 12 months, and a CD4 T-cell count of greater than 500 cells per μL. Participants were randomly assigned (1:1) to receive 3BNC117 plus romidepsin or romidepsin alone in two cycles. All participants received intravenous infusions of romidepsin (5 mg/m2 given over 120 min) at weeks 0, 1, and 2 (treatment cycle 1) and weeks 8, 9, and 10 (treatment cycle 2). Those in the 3BNC117 plus romidepsin group received an intravenous infusion of 3BNC117 (30 mg/kg given over 60 min) 2 days before each treatment cycle. An analytic treatment interruption (ATI) of ART was done at week 24 in both groups. Our primary endpoint was time to viral rebound during analytic treatment interruption, which was assessed in all participants who completed both treatment cycles and ATI. We used a log-rank test to compare time to viral rebound during analytic treatment interruption between the two groups. This trial is registered with ClinicalTrials.gov, NCT02850016. It is closed to new participants, and all follow-up is complete.

Findings: Between March 20, 2017, and Aug 14, 2018, 22 people were enrolled and randomly assigned, 11 to the 3BNC117 plus romidepsin group and 11 to the romidepsin group. 19 participants completed both treatment cycles and the ATI: 11 in the 3BNC117 plus romidepsin group and 8 in the romidepsin group. The median time to viral rebound during ATI was 18 days (IQR 14-28) in the 3BNC117 plus romidepsin group and 28 days (21-35) in the romidepsin group B (p=0·0016). Although this difference was significant, prolongation of time to viral rebound was not clinically meaningful in either group. All participants in both groups reported adverse events, but overall the combination of 3BNC117 and romidepsin was safe. Two severe adverse events were observed in the romidepsin group during 48 weeks of follow-up, one of which-increased direct bilirubin-was judged to be related to treatment.

Interpretation: The combination of 3BNC117 and romidepsin was safe but did not delay viral rebound during analytic treatment interruptions in individuals on long-term ART. The results of our trial could serve as a benchmark for further optimisation of HIV-1 curative strategies among people with HIV-1 who are taking suppressive ART.

Funding: amfAR, German Center for Infection Research.


Conflict of interest statement

Declaration of interests HG and FK are listed as inventors on a patent application for HIV-1 neutralising antibodies filed by the University of Cologne. MCN is listed as an inventor on patents for the antibody 3BNC117. All other authors declare no competing interests.

Figures

Figure 1.
Figure 1.
(A) CONSORT flow diagram and (B) the ROADMAP study design. Circles indicate time points of assessments.
Figure 1.
Figure 1.
(A) CONSORT flow diagram and (B) the ROADMAP study design. Circles indicate time points of assessments.
Figure 2.
Figure 2.
HIV-1 transcription, plasma HIV-1 RNA, total HIV-1 DNA, and intact proviruses. (A) Mean (SEM) fold increase in the level of cell-associated unspliced HIV-1 RNA from baseline (prior to first romidepsin infusion) to subsequent time points in each of the two treatment cycles. (B) Individual plasma HIV-1 RNA. The dotted line represents the limit of quantification (20 copies per mL). The arrows represent infusion time points. (C) Individual and median (IQR) level of total HIV-1 DNA per million CD4 T cells. (D) Individual and median (IQR) level of intact proviruses per million CD4 T cells. Two individuals in group B had 0 intact proviruses per million CD4 T cells at baseline. RMD=romidepsin. * P < 0·05.
Figure 2.
Figure 2.
HIV-1 transcription, plasma HIV-1 RNA, total HIV-1 DNA, and intact proviruses. (A) Mean (SEM) fold increase in the level of cell-associated unspliced HIV-1 RNA from baseline (prior to first romidepsin infusion) to subsequent time points in each of the two treatment cycles. (B) Individual plasma HIV-1 RNA. The dotted line represents the limit of quantification (20 copies per mL). The arrows represent infusion time points. (C) Individual and median (IQR) level of total HIV-1 DNA per million CD4 T cells. (D) Individual and median (IQR) level of intact proviruses per million CD4 T cells. Two individuals in group B had 0 intact proviruses per million CD4 T cells at baseline. RMD=romidepsin. * P < 0·05.
Figure 3.
Figure 3.
T cell immunity. (A) Proportion of polyfunctional HIV-1-specific memory CD8 T cells. Box-and-whisker plots show median values (line), 25th to 75th percentiles (box outline) and minimum and maximum values (whiskers) (B) Proportion of polyfunctional HIV-1-specific memory CD4 T cells. Box-and-whisker plots show median values (line), 25th to 75th percentiles (box outline) and minimum and maximum values (whiskers) (C) Individual proportion of the level of T-cell activation markers. Bars are median. RMD=romidepsin.
Figure 3.
Figure 3.
T cell immunity. (A) Proportion of polyfunctional HIV-1-specific memory CD8 T cells. Box-and-whisker plots show median values (line), 25th to 75th percentiles (box outline) and minimum and maximum values (whiskers) (B) Proportion of polyfunctional HIV-1-specific memory CD4 T cells. Box-and-whisker plots show median values (line), 25th to 75th percentiles (box outline) and minimum and maximum values (whiskers) (C) Individual proportion of the level of T-cell activation markers. Bars are median. RMD=romidepsin.
Figure 4.
Figure 4.
Time to viral rebound during analytical treatment interruption. (A) Individual plasma HIV-1 RNA levels after interruption of antiretroviral therapy; the dotted line represents the limit of quantification (20 copies per mL). (B) Proportion of individuals with plasma HIV-1 RNA of less than 200 copies per mL after interruption of antiretroviral therapy. ART=antiretroviral therapy, ATI=analytical treatment interruption, RMD=romidepsin.
Figure 4.
Figure 4.
Time to viral rebound during analytical treatment interruption. (A) Individual plasma HIV-1 RNA levels after interruption of antiretroviral therapy; the dotted line represents the limit of quantification (20 copies per mL). (B) Proportion of individuals with plasma HIV-1 RNA of less than 200 copies per mL after interruption of antiretroviral therapy. ART=antiretroviral therapy, ATI=analytical treatment interruption, RMD=romidepsin.

References

    1. Namazi G, Fajnzylber JM, Aga E, et al. The Control of HIV after Antiretroviral Medication Pause (CHAMP) study: post-treatment controllers identified from 14 clinical studies. J Infect Dis. 2018;(August):1–10. doi:10.1093/infdis/jiy479 - DOI - PMC - PubMed
    1. Deeks SG. HIV: Shock and kill. Nature. 2012;487(7408):439–440. doi:10.1038/487439a - DOI - PubMed
    1. Archin NM, Liberty AL, Kashuba AD, et al. Administration of vorinostat disrupts HIV-1 latency in patients on antiretroviral therapy. Nature. 2012;487(7408):482–485. doi:10.1038/nature11286 - DOI - PMC - PubMed
    1. Rasmussen TA, Tolstrup M, Brinkmann CR, et al. Panobinostat, a histone deacetylase inhibitor, for latent-virus reactivation in HIV-infected patients on suppressive antiretroviral therapy: a phase 1/2, single group, clinical trial. lancet HIV. 2014;1(1):e13–21. doi:10.1016/S2352-3018(14)70014-1 - DOI - PubMed
    1. Søgaard OS, Graversen ME, Leth S, et al. The Depsipeptide Romidepsin Reverses HIV-1 Latency In Vivo. Siliciano RF, ed. PLoS Pathog. 2015;11(9):e1005142. doi:10.1371/journal.ppat.1005142 - DOI - PMC - PubMed

Publication types

Associated data