. 2022 Jul;29(7):679-703.
doi: 10.1089/cmb.2021.0647. Epub 2022 May 11.

The Probability of Joint Monophyly of Samples of Gene Lineages for All Species in an Arbitrary Species Tree

Affiliations

The Probability of Joint Monophyly of Samples of Gene Lineages for All Species in an Arbitrary Species Tree

Rohan S Mehta et al. J Comput Biol. 2022 Jul.

Abstract

Monophyly is a feature of a set of genetic lineages in which every lineage in the set is more closely related to all other members of the set than it is to any lineage outside the set. Multiple sets of lineages that are separately monophyletic are said to be reciprocally monophyletic, or jointly monophyletic. The prevalence of reciprocal monophyly, or joint monophyly (JM), has been used to evaluate phylogenetic and phylogeographic hypotheses, as well as to delimit species. These applications often make use of a probability of JM under models of gene lineage evolution. Studies in coalescent theory have computed this JM probability for small numbers of separate groups in arbitrary species trees and for arbitrary numbers of separate groups in trivial species trees. In this study, generalizing existing results on monophyly probabilities under the multispecies coalescent, we derive the probability of JM for arbitrary numbers of separate groups in arbitrary species trees. We illustrate how our result collapses to previously examined cases. We also study the effect of tree height, sample size, and number of species on the probability of JM. We obtain relatively simple lower and upper bounds on the JM probability. Our results expand the scope of JM calculations beyond small numbers of species, subsuming past formulas that have been used in simpler cases.

Keywords: coalescent; gene tree; monophyly; probability; species tree.


Conflict of interest statement

The authors declare they have no conflicting financial interests.

Figures

FIG. 1.
FIG. 1.
Schematic of the general joint monophyly calculation. (A) Zhu et al. (2011) computed the probability of joint monophyly of arbitrarily many groups in a single population. (B) Mehta et al. (2016) computed the probability of joint monophyly of two groups in an arbitrary species tree. (C) Here, we compute the probability of joint monophyly of arbitrarily many groups in an arbitrary species tree. In each panel, the numbers and colors indicate groups, and the black lines represent a species tree.
FIG. 2.
FIG. 2.
Notation for input and output lineages. (A) An example of a species tree T, with five species and species label set S = {1,2,3,4,5}. An example branch x is highlighted with its branch length Tx. (B) Coalescences happening within a single branch [branch x in (A)] of a species tree. In this diagram, three lineages from species 1, three lineages from species 2, and a single mixed lineage enter the branch, and two lineages from species 1 and one mixed lineage exit the branch. Supposing this branch comes from a five-species tree, the input state is nxI=(3,3,0,0,0,1), and the output state is nxO=(2,0,0,0,0,1). The label 1 is a surviving label, and the label 2 is a lost label.
FIG. 3.
FIG. 3.
Interweaving of coalescence sequences. (A) Three coalescence sequences. The sequences are represented in three colors. Within a sequence, coalescences occur in a specified order, indicated by numbers within colors. Each of the six coalescences must occur in the interwoven sequence, represented by the gray blocks. Hence, each coalescence must be mapped to one of the gray blocks, with order increasing from bottom to top for each sequence. (B, C) Two different ways to interweave the sequences from (A).
FIG. 4.
FIG. 4.
Trees used to explore the effects of tree height and sample size on the probability of joint monophyly.
FIG. 5.
FIG. 5.
Joint monophyly probabilities for various numbers of species, tree heights, and sample sizes. Probabilities are obtained using Equation (11), with the same sample size assigned to each species. Each panel is labeled by the number of species.
FIG. 6.
FIG. 6.
Minimum sample sizes for the probability of joint monophyly to decrease below a particular cutoff probability, for varying tree height and number of species. Panel title indicates number of species.
FIG. 7.
FIG. 7.
The probability of joint monophyly [Eq. (11)] in relation to the probability of strong joint monophyly [Eq. (29)]. Strong joint monophyly provides a lower bound for joint monophyly. For each combination consisting of a number of species (2–6) and a sample size (2–10), a curve links points with increasing tree height (0–10 at intervals of 0.2). Parameter sets (number of species, tree height, sample size) follow Figure 4. The solid line indicates equality of the probabilities of joint monophyly and strong joint monophyly, and the dashed line indicates the upper bound on the probability of joint monophyly provided by Equation (30).
APPENDIX FIG. A1.
APPENDIX FIG. A1.
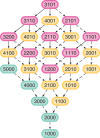
State space for the continuous-time Markov chain for the example branch in Section A.2. States are colored by the number of species for which JM is not yet determined (pink, two; yellow, one; green, none). Intraspecies transitions use a solid line; interspecies transitions use a dashed line. The Failure state is excluded; all states except those colored green can transition to the failure state. JM, joint monophyly.

Similar articles

Cited by

References

    1. Arbogast, B.S., Edwards, S.V., Wakeley, J., et al. . 2002. Estimating divergence times from molecular data on phylogenetic and population genetic timescales. Ann. Rev. Ecol. Syst. 33, 707–740.
    1. Baker, A.J., Tavares, E.S., and Elbourne, R.F.. 2009. Countering criticisms of single mitochondrial DNA gene barcoding in birds. Mol. Ecol. Resour. 9, 257–268. - PubMed
    1. Bergsten, J., Bilton, D.T., Fujisawa, T., et al. . 2012. The effect of geographical scale of sampling on DNA barcoding. Syst. Biol. 61, 851–869. - PMC - PubMed
    1. Birky, C.W., Wolf, C., Maughan, H., et al. . 2005. Speciation and selection without sex. Hydrobiologia. 546, 29–45.
    1. Brown, J.K. 1994. Probabilities of evolutionary trees. Syst. Biol. 43, 78–91.

Appendix Reference

    1. Grimmett, G.R., and Stirzaker, D.S.. 2020. Probability and Random Processes, 4th ed. Oxford University Press, Oxford, UK.

Publication types

LinkOut - more resources