. 2022 Sep 15;33(11):ar94.
doi: 10.1091/mbc.E21-11-0537. Epub 2022 May 11.

Superresolution microscopy reveals actomyosin dynamics in medioapical arrays

Affiliations

Superresolution microscopy reveals actomyosin dynamics in medioapical arrays

Regan P Moore et al. Mol Biol Cell. .

Abstract

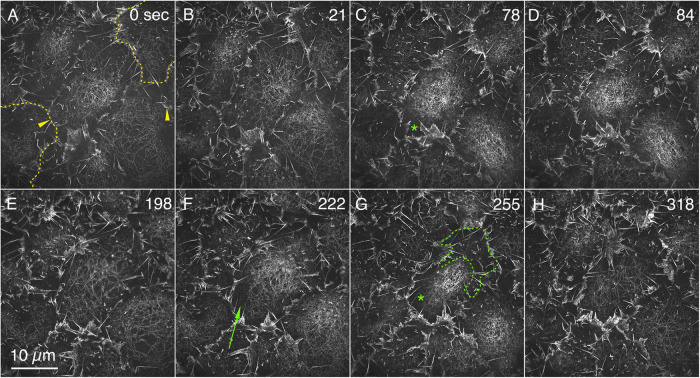
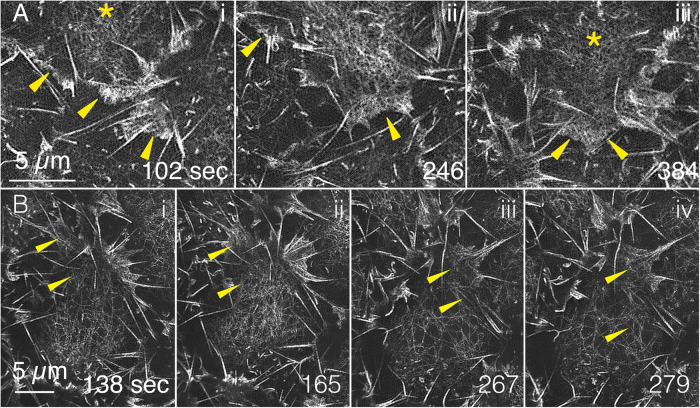
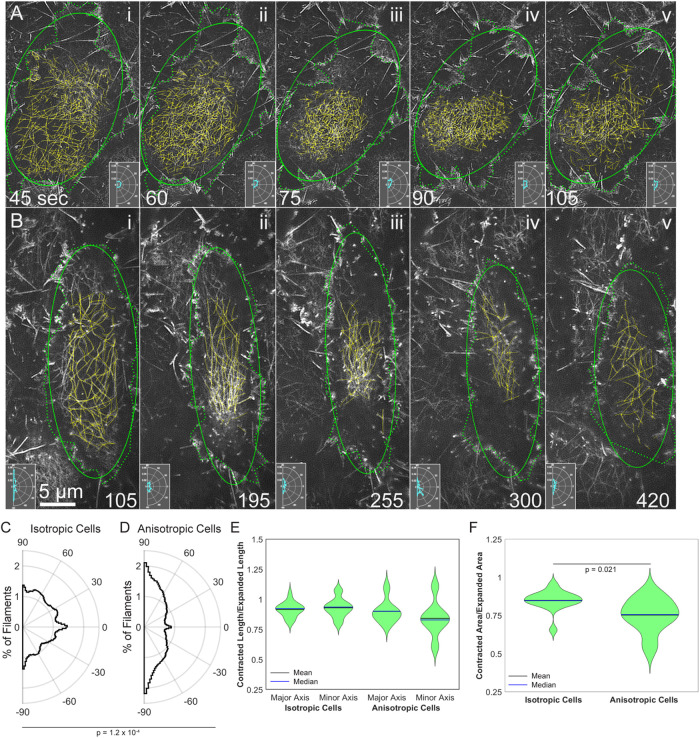
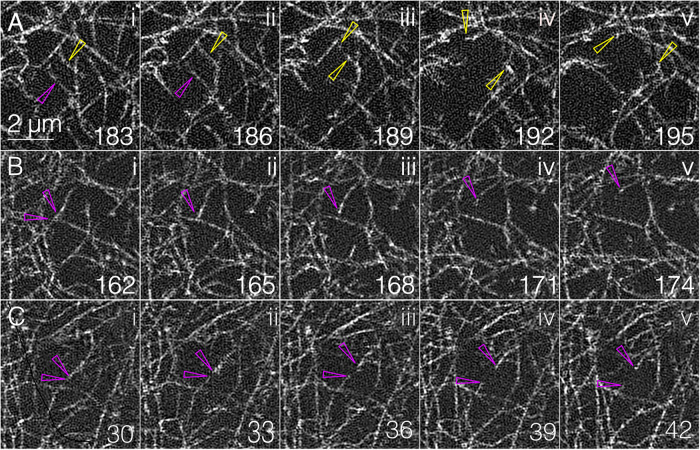
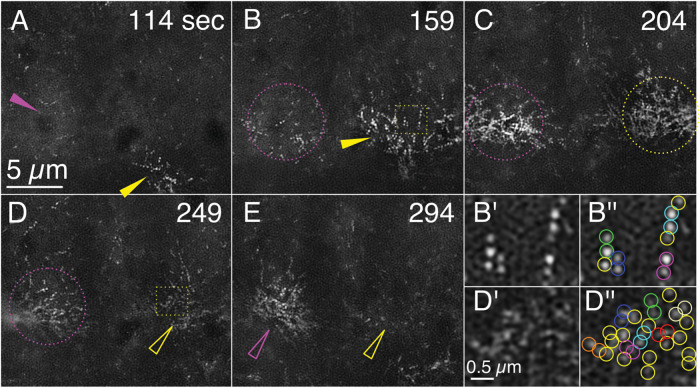
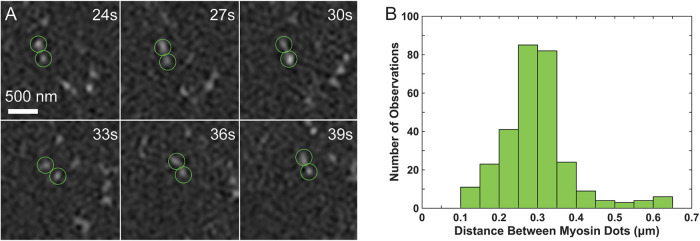
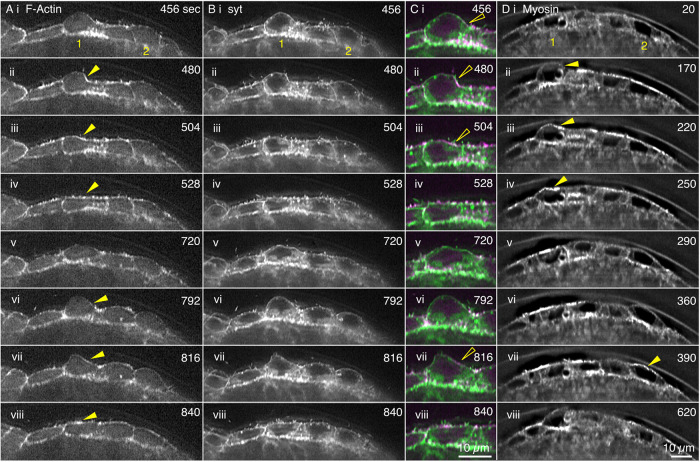
Arrays of actin filaments (F-actin) near the apical surface of epithelial cells (medioapical arrays) contribute to apical constriction and morphogenesis throughout phylogeny. Here, superresolution approaches (grazing incidence structured illumination, GI-SIM, and lattice light sheet, LLSM) microscopy resolve individual, fluorescently labeled F-actin and bipolar myosin filaments that drive amnioserosa cell shape changes during dorsal closure in Drosophila. In expanded cells, F-actin and myosin form loose, apically domed meshworks at the plasma membrane. The arrays condense as cells contract, drawing the domes into the plane of the junctional belts. As condensation continues, individual filaments are no longer uniformly apparent. As cells expand, arrays of actomyosin are again resolved-some F-actin turnover likely occurs, but a large fraction of existing filaments rearrange. In morphologically isotropic cells, actin filaments are randomly oriented and during contraction are drawn together but remain essentially randomly oriented. In anisotropic cells, largely parallel actin filaments are drawn closer to one another. Our images offer unparalleled resolution of F-actin in embryonic tissue, show that medioapical arrays are tightly apposed to the plasma membrane and are continuous with meshworks of lamellar F-actin. Medioapical arrays thereby constitute modified cell cortex. In concert with other tagged array components, superresolution imaging of live specimens will offer new understanding of cortical architecture and function.


Figures

FIGURE 1:
FIGURE 1:
Actin filaments are resolved by GI-SIM in condensing and relaxing medioapical arrays. F-actin is labeled with GFP-MoeABD. (A–H) Stills are a ROI from a time-lapsed sequence of amnioserosa cells in various states of apical contraction (Supplemental Movie 1, select portions magnified in Supplemental Movies 5 and 8). Comparable patterns of F-actin are seen labeled with Lifeact-mEGFP (Supplemental Movie 2). The dotted yellow lines in A show our estimate of the cell outlines of two cells at the periphery of the image (the relationship between the lamellipodia and filopodia and cell junctions is shown in Supplemental Figure 1 and Supplemental Movie 3). Yellow arrowheads in A show where filaments extend toward a bright band of lamellipodia and filopodia that project parallel to the optic axis. The green arrow in F points to filaments in a dark region of the cell that would appear as a low level of background fluorescence (a dark patch) by standard confocal methods. The green outline in G shows the upper half of a dark halo that surrounds the concentration of filaments in this cell. The green asterisks in C and G also label the dark halos in that central cell. Time is in seconds from the start of imaging.
FIGURE 2:
FIGURE 2:
GI-SIM shows that medioapical arrays are continuous with lamellipodia. F-actin labeled with GFP-MoeABD. (A) Three panels are magnified ROIs from Supplemental Movie 1 that show medioapical arrays (yellow asterisks) where they merge with the lamellipodia (yellow arrowheads). (B) Four additional panels (from a different embryo) also demonstrate continuity between medioapical arrays and lamellipodia. The top panel in Supplemental Movie 5 includes each of the time points shown in the top row of Figure 2; the bottom panel in Supplemental Movie 5 shows time points 120–330 s.
FIGURE 3:
FIGURE 3:
Actin filament array condensation and relaxation parallels amnioserosa cell contraction and expansion in (A) an isotropically and (B) an anisotropically contracting cell. F-actin labeled with (A) GFP-MoeABD from Supplemental Movie 1 or (B) Lifeact-mEGFP from Supplemental Movie 2. Dotted green lines—outline of cells based on the position of lamellipodia and filopodia. Solid green ellipse—depicts an ellipse fitted to the cell outline. Yellow lines—manual traces of individual actin filaments. Polar histogram insets depict the orientation of traced actin filaments. (C) Average distribution of filament orientation in six isotropic cells from four embryos. (D) Average distribution of filament orientation in six anisotropic cells from four embryos. The distributions shown in C and D are significantly different with a p = 0.00012. (E) Ratio of contracted axis length to expanded axis length in isotropic and anisotropic cells; n = 15 contractions from the six isotropic cells traced and n = 7 contractions from the six anisotropic cells traced. (F) Ratio of contracted area to expanded area in isotropic and anisotropic cells; n = 15 contractions from the six isotropic cells traced and n = 7 contractions from the six anisotropic cells traced. Anisotropic cells showed a greater reduction in area with p = 0.021. Time is in seconds from the start of imaging. Animated versions of F-actin dynamics are shown in Supplemental Movies 6 and 7 for an isotropic and anisotropic cell, respectively.
FIGURE 4:
FIGURE 4:
GI-SIM shows single-filament severing. (A) Five panels from Supplemental Movie 1 show filament severing. Hollow yellow and magenta arrowheads in i show a top and bottom filament that become stretched in ii. Both filaments are severed between ii and iii, and the bottom filament leaves the image plane. Hollow yellow arrowheads in iii–v point to the filament ends that spring apart under tension. (B, C) Two additional severing events; magenta arrowheads show the filaments before (panels i) and after (panels ii–v) severing. Filament breakage is also shown in Supplemental Movie 8.
FIGURE 5:
FIGURE 5:
Myosin filaments are resolved as paired dots by GI-SIM in condensing and relaxing medioapical arrays. Panels A–E are still images from Supplemental Movie 9 taken at the timepoints shown. Maximum condensations of myosin arrays in two adjacent cells are depicted and tracked by magenta and yellow arrowheads, hollow arrowheads, or dotted circles. Solid arrows track the direction of movement of the condensation. Dotted circles indicate an array that is condensing but whose centroid is roughly fixed. Hollow arrowheads point to an array that is relaxing. Dotted yellow boxes in B and D are magnified in B′ and B′′ and D′ and D′′), respectively. B′′ and D′′ are identical to B′ and D′, respectively, except that dots that contribute to bipolar filaments identified by comigration are shown circled in blue, cyan, green, orange, magenta, and red, whereas dots that could not be unambiguously identified as a member of a pair are circled in yellow. Dynamics of myosin filament distributions are shown in Supplemental Movie 9.
FIGURE 6:
FIGURE 6:
Myosin filaments can be tracked through time and have lengths (0.30 ± 0.01 µm) consistent with previous reports. (A) Putative myosin bipolar filaments can be tracked for multiple frames. Time points are from Supplemental Movie 9. (B) The distance between the heads of putative pairs is ∼300 nm; n = 292 measuements from 50 pairs.
FIGURE 7:
FIGURE 7:
Cross-sections from LLSM data sets show that amnioserosa cells bulge into the perivitelline space, actin and myosin accumulate to “rescue” bulges, and the actin cortex colocalizes with the plasma membrane. Images from time-lapse sequences of the amnioserosa in two different embryos. The (anti-)correlation between bulge retraction and the accumulation of myosin is shown in Supplemental Figure 5. (A–C) Amnioserosa cells in an embryo double labeled for F-actin with RFP-MoeABD and the plasma membrane with Syt-GFP shows two cells (1 and 2) that bulge into the perivitelline space. (A, B) Black-and-white images of approximately six cells in the amnioserosa. (C) Magnified view of cell 1 double labeled with F-actin in magenta and plasma membrane in green. (D) GFP-Myosin knockin-labeled amnioserosa. Cells 1 and 2 bulge into the perivitelline space. Yellow arrowheads in A and D show the accumulation of actin and myosin, respectively, on a bulge and then its rescue. Hollow yellow arrowheads show colocalization of medioapical array (F-actin) and plasma membrane (Syt-GFP). Scale bar in Cviii is for all panels in C; scale bar in Dviii is for all panels in A, B, and D. Time is in seconds from the start of imaging. Dynamics of actin, syt, and myosin are shown in Supplemental Movie 10.

Similar articles

Cited by

References

    1. Aristotelous AC, Crawford JM, Edwards GS, Kiehart DP, Venakides S (2018). Mathematical models of dorsal closure. Prog Biophys Mol Biol 137, 111–131. - PMC - PubMed
    1. Azevedo D, Antunes M, Prag S, Ma X, Hacker U, Brodland GW, Hutson MS, Solon J, Jacinto A (2011). DRhoGEF2 regulates cellular tension and cell pulsations in the amnioserosa during Drosophila dorsal closure. PloS One 6, e23964. - PMC - PubMed
    1. Belin BJ, Cimini BA, Blackburn EH, Mullins RD (2013). Visualization of actin filaments and monomers in somatic cell nuclei. Mol Biol Cell 24, 982–994. - PMC - PubMed
    1. Blanchard GB, Murugesu S, Adams RJ, Martinez-Arias A, Gorfinkiel N (2010). Cytoskeletal dynamics and supracellular organisation of cell shape fluctuations during dorsal closure. Development 137, 2743–2752. - PubMed
    1. Brand AH, Perrimon N (1993). Targeted gene expression as a means of altering cell fates and generating dominant phenotypes. Development 118, 401–415. - PubMed

Publication types

LinkOut - more resources