. 2022 May 13;8(19):eabj6894.
doi: 10.1126/sciadv.abj6894. Epub 2022 May 11.

A bioactive phlebovirus-like envelope protein in a hookworm endogenous virus

Affiliations

A bioactive phlebovirus-like envelope protein in a hookworm endogenous virus

Monique Merchant et al. Sci Adv. .

Abstract

Endogenous viral elements (EVEs), accounting for 15% of our genome, serve as a genetic reservoir from which new genes can emerge. Nematode EVEs are particularly diverse and informative of virus evolution. We identify Atlas virus-an intact retrovirus-like EVE in the human hookworm Ancylostoma ceylanicum, with an envelope protein genetically related to GN-GC glycoproteins from the family Phenuiviridae. A cryo-EM structure of Atlas GC reveals a class II viral membrane fusion protein fold not previously seen in retroviruses. Atlas GC has the structural hallmarks of an active fusogen. Atlas GC trimers insert into membranes with endosomal lipid compositions and low pH. When expressed on the plasma membrane, Atlas GC has cell-cell fusion activity. With its preserved biological activities, Atlas GC has the potential to acquire a cellular function. Our work reveals structural plasticity in reverse-transcribing RNA viruses.


Figures

Fig. 1.
Fig. 1.. Atlas is an endogenous belpaovirus with a phlebovirus-like Env.
(A) Gene architecture of the Atlas EVE, gene Acey_s0020.g108 from the A. ceylanicum human hookworm parasite. Inset: Annotated close-up of the Atlas Env region encoding phlebovirus GN- and GC-like glycoproteins. Red residue numbers refer to the GC sequence alone. a.a., amino acid. TM, transmembrane; DI, domain I; DII, domain II; DIII, domain III. (B) List of A. ceylanicum EVEs encoding complete Gag-Pol-Env polyproteins with phlebovirus-like Envs. LTR sequence identities for two of the EVEs could not be calculated: Acey_s0206.g1994 had degenerate LTRs, and one LTR of Acey_s0025.g1106 was truncated in the genome assembly. bp, base pair. (C) Phylogenetic tree of GC proteins from Phenuiviridae and GC-like (G2-like) sequences from EVEs. Ace, A. ceylanicum; Cel, C. elegans; Nam, Necator Americanus, RVFV, Rift Valley fever virus; DabieV, Dabie bandavirus (SFTSV); HRTV, Heartland virus. (D) Phylogenetic classification of Atlas based on RT sequences. Alu TasV, Ascaris lumbricoides Tas virus; Dsi NinV, Drosophila simulans Ninja virus; Bmo PaoV, Bombyx mori Pao virus; Tru SuzV, Takifugu rubripes Suzu virus; Dme BelV, D. melanogaster Bel virus; Aga MooV, Anopheles gambiae Moose virus; RooV, Roo virus. Trees were drawn with iTOL v6.
Fig. 2.
Fig. 2.. Cryo-EM structure of a phlebovirus GC-like Env fragment from Atlas virus.
(A) Domain organization of Atlas GC. (B) Cryo-EM image reconstruction of a soluble ectodomain fragment of Atlas GC at 3.76 Å overall resolution. The purified protein was a homotrimer (fig. S2), and threefold (C3) symmetry was imposed. The map is colored by domain as in (A). A representative cryo-EM micrograph is shown in fig. S4A. (C) Overview of the refined atomic model of the Atlas GC trimer. Disulfide bonds (green) and an N-linked glycan (blue) are shown as sticks. (D) A single Atlas GC protomer. (E) Protomer from the AlphaFold-Multimer structure prediction for the GC trimer. The backbone is colored by model confidence [measured with the predicted local distance difference test (pLDDT)]; side chains of disulfide-bonded cysteines are in green. (F) The structures most similar to Atlas GC based on structure comparison with DALI (71), GC glycoproteins from RVFV [root mean square deviation (RMSD), 2.6 Å; z score, 29; PDB: 6EGU (27)], DABV [formerly SFTS phlebovirus; RMSD, 2.6 Å; z score, 28; PDB: 5G47 (43)], and HRTV (RMSD, 2.6 Å; z score, 28; PDB: 5YOW (44)]. Other representative class II fusion proteins are shown for comparison: SFV E1 [z score, 19; PDB: 1RER (26)], C. elegans EFF-1 [z score, 19; PDB: 4OJD (28)], Chlamydomonas reinhardtii HAP2 [z score, 16; PDB: 5MF1 (32)], and dengue virus (DENV) E [z score, 14; PDB: 3G7T (46)].
Fig. 3.
Fig. 3.. Structure of the putative fusion loop and lipid binding pocket of Atlas GC.
(A) Local sequence alignment of the fusion loops (orange boxes) of Atlas GC, RVFV GC, and DENV E. Green dumbbells indicate disulfides. Disulfides shown below the RVFV sequence are conserved in Atlas and RVFV. (B) Residues contributing to binding of the phosphate (Phos), glycerol, and choline (Chol) moieties of glycerophospholipid (GPL) molecules by RVFV GC (27). Colors indicate side chain properties: blue, positive charge; pink, negative charge; magenta, hydrophobic; green, sulfhydryl; light blue, positive charge at endosomal pH. (C) Close-up of the fusion loop and GPL binding pockets of Atlas GC, RVFV GC, and DENV E. A single protomer from the postfusion trimer is shown, with key residues shown in stick representation. Label colors indicate side chain properties: blue, positive charge; red, negative charge; orange, hydrophobic. The AlphaFold-Multimer model is colored by model confidence as in Fig. 2. (D) Close-up of the fusion loop and GPL binding pocket of the Atlas GC trimer showing histidine residues in or near the pocket. Prime symbols following residue numbers denote the protomer to which the residue belongs. (E) Surface representation of the same view as in (D), colored by side chain hydrophobicity, except for histidine residues shown in light blue. (F) Close-up of the fusion loop and GPL binding pocket of the Atlas GC AlphaFold-Multimer trimer model, same view as in (D).
Fig. 4.
Fig. 4.. Atlas GC ectodomain binds liposomes in a lipid- and pH-dependent manner.
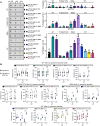
(A) Liposome coflotation lipid binding assay. A liposome-GC ectodomain mixture in 40% OptiPrep density gradient medium was overlaid with a 30% OptiPrep cushion and centrifuged at 100,000g. Flotation was defined as the amount of GC ectodomain cofloating with liposomes in the top-half (T) fraction divided by the total amount of GC ectodomain in the top- and bottom-half (B) fractions. GC ectodomain was quantified by Coomassie-stained SDS-PAGE. Error bars show the SD of three replicates except wild-type (WT) + PC:PE:SM:CH:PS (two replicates) and WT + PC:PE:SM:BMP (four replicates). See fig. S8 for uncropped gels for all replicates. (B) Binding of GC ectodomain (WT, F136A/F137A or R86A) to liposomes measured by DLS as differences in liposome diameter in the presence and absence of Atlas GC ectodomain. Error bars show the SD of three to seven replicates. Significance was determined by two-way ANOVA of the mean change in liposome diameter, using Sidak’s multiple comparisons test with a 95% confidence interval in GraphPad Prism 8 (see fig. S7). *P < 0.05; **P < 0.01; ns, not significant. See dataset S1 for source data.
Fig. 5.
Fig. 5.. Atlas GC oligomerization and disulfide bonding.
(A) SEC–multiangle light scattering (MALS) of Atlas GC ectodomain (residues 2330 to 2772). The protein formed trimers. (B) SEC of Atlas GC(DI-III) (residues 2330 to 2751) expressed in a mixture of oligomeric states, including monomers, trimers, and larger aggregates (void peak). GC(DI-III) monomers were unstable. (C) His258, His333, and His336 form interprotomer or interdomain polar contacts predicted to stabilize the GC trimer specifically at pH < 6, when the histidine side chains are charged. Residues from different protomers are denoted with a prime symbol. (D) View along the threefold axis of the GC trimer with intramolecular disulfides between the cysteines most proximal to the axis, Cys129 and Cys138.
Fig. 6.
Fig. 6.. Cell-cell fusion assay.
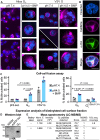
(A) Confocal micrographs of CHO cells expressing Atlas GC fused to the transmembrane anchor from HLA-A2 or VSV G. Cells were treated with pH 4.5 buffer containing BMP or pH 7.4 buffer without lipid. Blue, Hoechst 33342 nuclear stain; magenta, CellBrite Red plasma membrane dye. Micrographs were selected to show fusion events—see fig. S9 for representative raw micrographs. Scale bars, 10 μm. (B) Confocal micrograph of a multinucleated CHO cell expressing Atlas GC following treatment with pH 4.5 and BMP. Blue, Hoechst 33342; magenta, CellBrite Red; green, α-HA antibody for Atlas GC detection. Scale bar, 10 μm. A composite Z stack of this cell is shown in movie S1. (C) The fraction of multinuclear cells transfected with plasmids encoding Atlas GC, VSV G, or pHLsec empty vector was calculated by counting mono- and multinucleated cells using the Hoechst and CellBrite stains. Error bars represent SD between measurements from three distinct experiments, with 33 to 568 nuclear clusters counted per replicate. P values were calculated by two-way analysis of variance (ANOVA) (Tukey’s multiple comparisons test, GraphPad Prism 9). (D and E) GC cell surface expression analysis. Cells were biotinylated, cell surface proteins were affinity-purified with NeutrAvidin agarose, and the cell surface GC fraction was quantified by Western blot (D) and LC-MS/MS (E). See dataset S2 for source data.

References

    1. Frank J. A., Feschotte C., Co-option of endogenous viral sequences for host cell function. Curr. Opin. Virol. 25, 81–89 (2017). - PMC - PubMed
    1. Katzourakis A., Gifford R. J., Endogenous viral elements in animal genomes. PLOS Genet. 6, e1001191 (2010). - PMC - PubMed
    1. Friedli M., Trono D., The developmental control of transposable elements and the evolution of higher species. Annu. Rev. Cell Dev. Biol. 31, 429–451 (2015). - PubMed
    1. Chuong E. B., Elde N. C., Feschotte C., Regulatory evolution of innate immunity through co-option of endogenous retroviruses. Science 351, 1083–1087 (2016). - PMC - PubMed
    1. Dupressoir A., Lavialle C., Heidmann T., From ancestral infectious retroviruses to bona fide cellular genes: Role of the captured syncytins in placentation. Placenta 33, 663–671 (2012). - PubMed

Substances