. 2022 May 13;8(19):eabn5907.
doi: 10.1126/sciadv.abn5907. Epub 2022 May 11.

MicroRNA-resistant alleles of HOMEOBOX DOMAIN-2 modify inflorescence branching and increase grain protein content of wheat

Affiliations

MicroRNA-resistant alleles of HOMEOBOX DOMAIN-2 modify inflorescence branching and increase grain protein content of wheat

Laura E Dixon et al. Sci Adv. .

Abstract

Plant and inflorescence architecture determine the yield potential of crops. Breeders have harnessed natural diversity for inflorescence architecture to improve yields, and induced genetic variation could provide further gains. Wheat is a vital source of protein and calories; however, little is known about the genes that regulate the development of its inflorescence. Here, we report the identification of semidominant alleles for a class III homeodomain-leucine zipper transcription factor, HOMEOBOX DOMAIN-2 (HB-2), on wheat A and D subgenomes, which generate more flower-bearing spikelets and enhance grain protein content. These alleles increase HB-2 expression by disrupting a microRNA 165/166 complementary site with conserved roles in plants; higher HB-2 expression is associated with modified leaf and vascular development and increased amino acid supply to the inflorescence during grain development. These findings enhance our understanding of genes that control wheat inflorescence development and introduce an approach to improve the nutritional quality of grain.


Figures

Fig. 1.
Fig. 1.. CAD1290 displays modified spikelet and plant architecture.
(A to C) A screen of the (A) cv. Cadenza wheat mutant population identified (B) class I (e.g., CAD2071) and (C) class II (e.g., CAD1290) paired spikelet–producing mutant lines. (D to E) Inflorescences of ps1 and Ps1/ps1 (CAD1290 progeny) produce multiple secondary spikelets (pink), relative to wild-type (WT) siblings. (F and G) ps1 plants grown in controlled long daylengths display reduced stature (F) and curled leaves [(F), inset, and (G)], relative to WT. (H) The secondary spikelets of ps1 form predominantly in the central region of the inflorescence: bins 0 to 0.1 and 0.91 to 1 indicate the base and apex of the inflorescence, respectively. (I) Inflorescence growth rate and (J) flowering time analysis of Ps1/ps1 and ps1, relative to their wild-type sibling line; the timing of double-ridge (DR) and terminal spikelet (TS) stages are indicated by arrows. (K to M) Scanning electron microscopy analysis shows that secondary spikelets (shown in pink) form on (L) Ps1/ps1 and (M) ps1 inflorescences during early developmental stages, but not in WT (K). (N and O) Safranin-stained cross sections of WT and ps1 leaves, indicating the abnormal abaxial side of the midrib in ps1 (highlighted by asterisk). Scale bars, 1 cm (D and G), 10 cm (F), and 100 μm (K to O). (H to J) Data are the average ± SEM of four (I) or eight (H) biological replicates. In the boxplots (E and J), each box is bound by the lower and upper quartiles, the central bar represents the median, and the whiskers indicate the minimum and maximum values of 20 (E) or 8 to 14 (J) biological replicates. **P < 0.01 and ***P < 0.001.
Fig. 2.
Fig. 2.. Identification of a mutant allele of HB-D2 that promotes paired spikelet development and leaf curling.
(A) Exome capture sequence analysis identified a region on chromosome 1D that associates with paired spikelet development; genes with identified mutations are indicated, including HB-D2 (highlighted in green; the gene prefix is TraesCS). The region of chromosome 1D investigated further is indicated by dashed red line; the complete list of genes in this region is shown in table S10. (B) HB-D2 gene structure with exons (green), untranslated region (white), introns (black line), and the identified mutation (red line). (C) Phylogenetic tree of HD-ZIP III transcription factors in wheat (Ta), rice (Os), maize (Zm), and Arabidopsis (At). The HB1/2 clade is shown in blue; HB3/4 clade is shown in pink, and HB5 clade is shown in yellow. (D) Expression of HB-D2 in developing inflorescences of pAct:HB-D2 transgenic lines (T1 generation), relative to null control lines. (E to G) The pAct:HB-D2 transgenic lines form paired spikelets (secondary spikelets are shown in pink) and curled leaves (see inset) (G). Scale bars, 1 kb (B), 1 cm [(E) and (G), inset], and 5 cm (G). (D) Data are the average ± SEM of four biological replicates. In the boxplot (F), each box is bound by the lower and upper quartiles, the central bar represents the median, and the whiskers indicate the minimum and maximum values of 5 to 10 biological replicates. In (D) and (F), statistical significance is relative to the null control line #1; *P < 0.05 and **P < 0.01.
Fig. 3.
Fig. 3.. HB-2 is expressed in the spikelet primordia of developing wheat inflorescences.
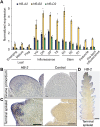
(A) All three homeologs of HB-2 are expressed strongly in developing inflorescences during early stages when spikelets form and in stem nodes, as well as lowly in leaves and emerging inflorescences. (B to D) In situ PCR analysis shows that HB-2 is expressed in the peripheral cell layers of spikelet primordia during the glume primordium (B) and terminal spikelet (C and D) stages. VG, vegetative; DR, double ridge; GP, glume primordium; TS, terminal spikelet; N3, node 3; N2, node 2; N1, node 1. N3 is the basal node, and N1 is the apical node. In (A), data are the average ± SEM of three to four biological replicates. Scale bars, 10 μm (B), 100 μm (C) and 0.5 mm (D).
Fig. 4.
Fig. 4.. Mutations in the microRNA complementary site of HB-2 promote paired spikelet development.
(A) The identified G > A mutation (red text) of ps1 is in the miR165/166 complementary site of HB-D2. (B) HB-D2 is expressed higher in leaves and developing inflorescences (Inflor.) of Ps1/ps1 and ps1 lines, relative to wild-type siblings. (C) An independent class II paired spikelet–producing mutant (CAD1761), named ps2, contains a G > A mutation (red text) in the miR165/166 complementary site of HB-A2. (D and E) Heterozygous and homozygous ps2 mutants form paired spikelets (secondary spikelets are shown in pink) and (F) express HB-A2 significantly higher in developing inflorescences but not in leaves. (B and F) Data are the average ± SEM of four biological replicates. In the boxplot (E), each box is bound by the lower and upper quartiles, the central bar represents the median, and the whiskers indicate the minimum and maximum values of eight biological replicates. Scale bar, 1 cm (D). *P < 0.05, **P < 0.01, and ***P < 0.001.
Fig. 5.
Fig. 5.. Environmental and genetic analysis of the interaction between HB-2 and the photoperiod-dependent flowering pathway.
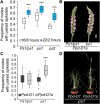
(A) The Ps1/ps1, ps1, and ps2 mutants form significantly more paired spikelets under extra-long daylengths (22/2 hours) relative to standard long-day conditions (16/8 hours). (B to D) Phenotypic analysis of (B and C) inflorescence and (D) plant architecture traits of the Ps1/ps1 and ps1 lines that express the photoperiod-insensitive Ppd-D1a allele, relative to photoperiod sensitive sibling lines (Ppd-D1). In the boxplots (A and C), each box is bound by the lower and upper quartiles, the central bar represents the median, and the whiskers indicate the minimum and maximum values of 12 to 24 biological replicates. Scale bars, 1 cm (B) and 5 cm (D). ***P < 0.001.
Fig. 6.
Fig. 6.. Analysis of gene expression during early inflorescence development.
(A) Spikelet meristem identity genes identified to be differentially expressed in other paired spikelet–producing genotypes are not significantly different in Ps1/ps1 and ps1 relative to wild-type siblings. (B and C) TB-B1 is more highly expressed in Ps1/ps1, ps1, and ps2 mutants relative to their respective wild-type siblings and in pAct:HB-D2 transgenic lines compared to null control lines. (D and E) Heatmaps of DEGs identified in developing inflorescences of (D) Ps1/ps1 and (E) ps1 relative to wild-type siblings. Identified GO terms are indicated at the left of the heatmap. For down-regulated DEGs, TPM values are normalized to wild type that is set at 1, and for up-regulated DEGs, the Ps1/ps1 and ps1 TPM value is set at 1. (F) Heatmap of DEGs in developing inflorescences of ps1 that have been identified in wheat (black text), maize (blue text), or Arabidopsis (red text) to have roles during inflorescence/floral or leaf development. Data of Ps1/ps1 and ps1 are normalized TPM values of three biological replicates shown as a log2 fold changes relative to WT. *P < 0.05 and **P < 0.01.
Fig. 7.
Fig. 7.. Analysis of yield and grain quality traits of field-grown Ps1/ps1 and ps1 plants.
(A and B) Field-grown Ps1/ps1 and ps1 plants form multiple secondary spikelets (pink) relative to wild-type siblings. (C to E) The weight and number of grain per inflorescence, and thousand grain weight, of Ps1/ps1 and ps1 plants relative to wild-type siblings. (F and G) The grain produced by Ps1/ps1 and ps1 have higher levels of protein (F) and free amino acids (mg/g of flour) than those produced by wild-type siblings. In (F) and (G), data are the average ± SEM of four biological replicates. In the boxplots, each box is bound by the lower and upper quartiles, the central bar represents the median, and the whiskers indicate the minimum and maximum values of six to eight biological replicates. Scale bar, 1 cm (A). *P < 0.05, **P < 0.01, and ***P < 0.001.
Fig. 8.
Fig. 8.. Analysis of plant vasculature, hydraulic conductivity, and rachis amino acid content.
(A and B) In situ PCR analysis shows that HB-2 is expressed in vascular bundles of the stem [bordered by dashed line, with regions of xylem (X) and phloem (P) indicated] and in cells surrounding the vasculature. (B) A negative control of the in situ PCR analysis. (C and D) Toluidine blue–stained cross sections of peduncles from (C) ps1 mutants relative to its wild-type sibling (D). (E) Stems of Ps1/ps1 and ps1 plants contain more vascular bundles than wild-type siblings. (F) Analysis of hydraulic conductivity in the peduncle and mature inflorescence of Ps1/ps1 and ps1 relative to its wild-type sibling. (G) Levels of abundant amino acids are higher in rachises of Ps1/ps1 and ps1 relative to wild-type siblings (WT). In the boxplots (E and F), the box is bound by the lower and upper quartiles, the central bar represents the median, and whiskers indicate the minimum and maximum values of (E) five to eight and (F) seven biological replicates. (G) Data are the average ± SEM of six biological replicates. Scale bars, 10 μm (A) and 100 μm (B and D).

References

    1. Shiferaw B., Smale M., Braun H. J., Duveiller E., Reynolds M., Muricho G., Crops that feed the world 10. Past successes and future challenges to the role played by wheat in global food security. Food Security 5, 291–317 (2013).
    1. Reynolds M., Foulkes M. J., Slafer G. A., Berry P., Parry M. A. J., Snape J. W., Angus W. J., Raising yield potential in wheat. J. Exp. Bot. 60, 1899–1918 (2009). - PubMed
    1. Sreenivasulu N., Schnurbusch T., A genetic playground for enhancing grain number in cereals. Trends Plant Sci. 17, 91–101 (2012). - PubMed
    1. Adamski N. M., Borrill P., Brinton J., Harrington S. A., Marchal C., Bentley A. R., Bovill W. D., Cattivelli L., Cockram J., C.-Moreira B., Ford B., Ghosh S., Harwood W., H.-Pak K., Hayta S., Hickey L. T., Kanyuka K., King J., Maccaferrri M., Naamati G., Pozniak C. J., R.-Gonzalez R. H., Sansaloni C., Trevaskis B., Wingen L. U., Wulff B. B. H., Uauy C., A roadmap for gene functional characterisation in crops with large genomes: Lessons from polyploid wheat. eLife 9, e55646 (2020). - PMC - PubMed
    1. IWGSC , Shifting the limits in wheat research and breeding using a fully annotated reference genome. Science 361, eaar7161 (2018). - PubMed