. 2022 May 13;8(19):eabh2332.
doi: 10.1126/sciadv.abh2332. Epub 2022 May 11.

Tankyrase-mediated ADP-ribosylation is a regulator of TNF-induced death

Affiliations

Tankyrase-mediated ADP-ribosylation is a regulator of TNF-induced death

Lin Liu et al. Sci Adv. .

Abstract

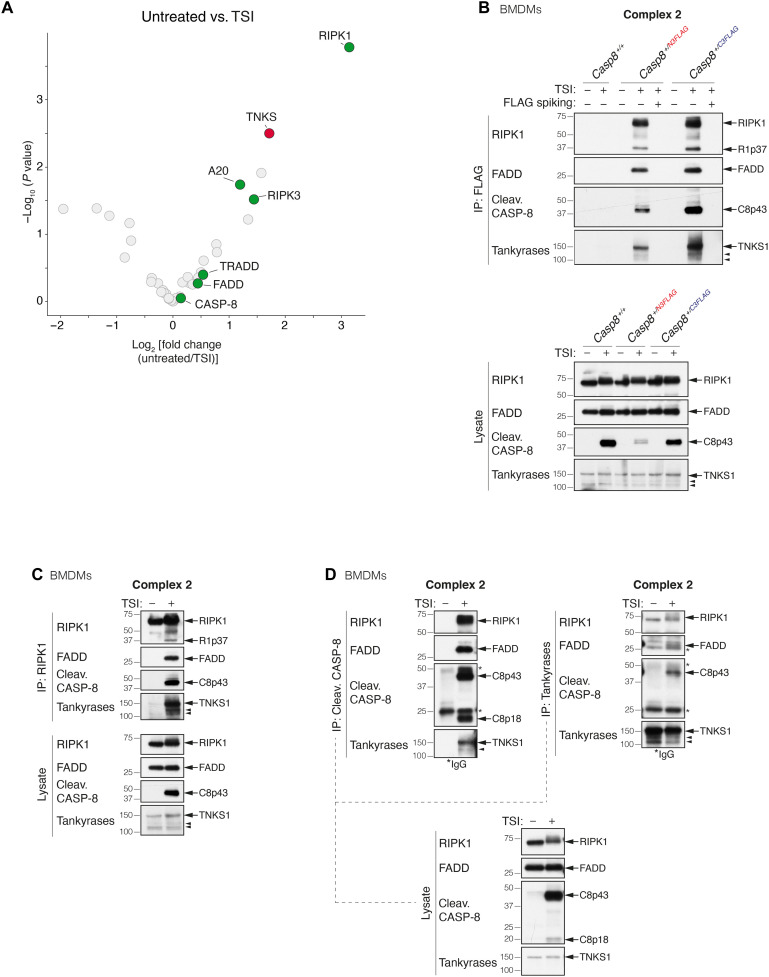
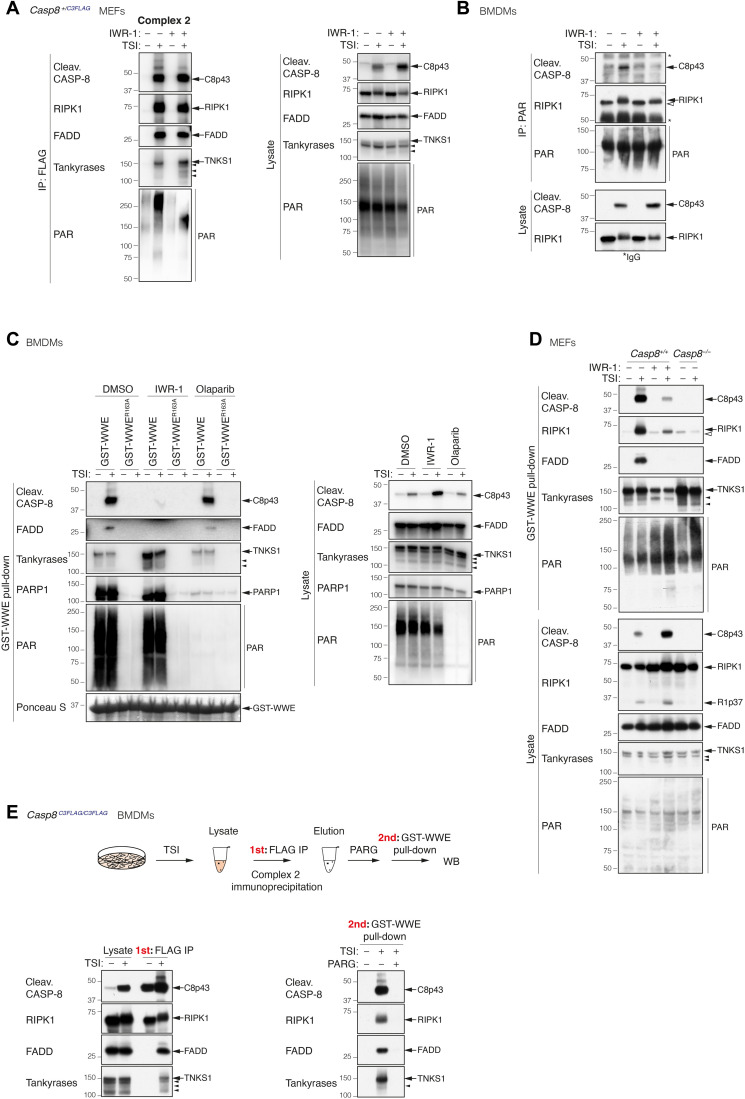
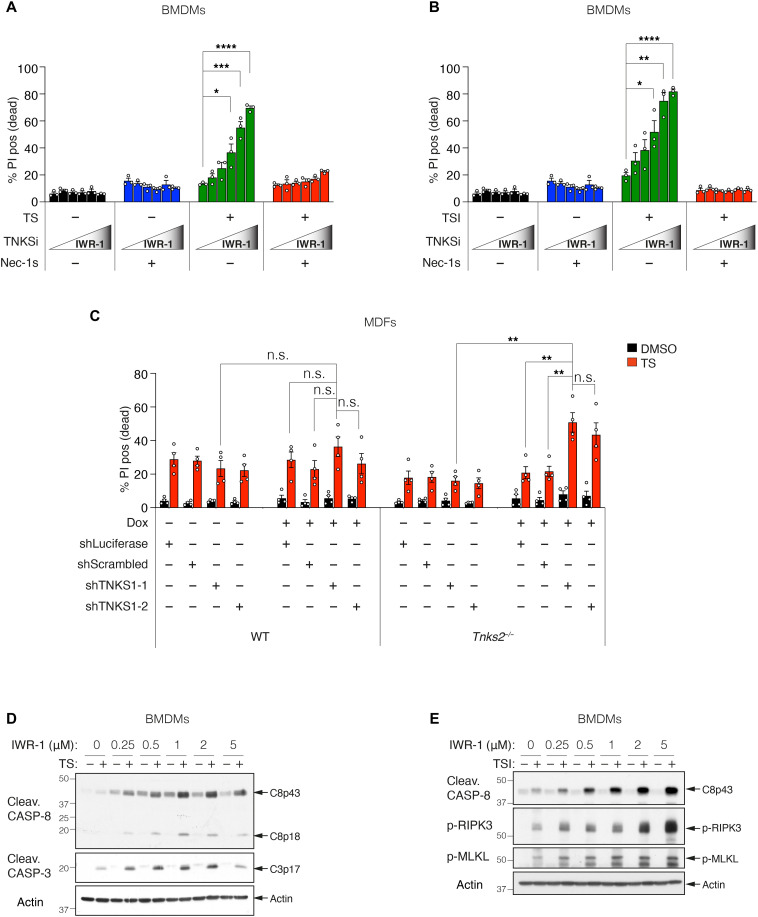
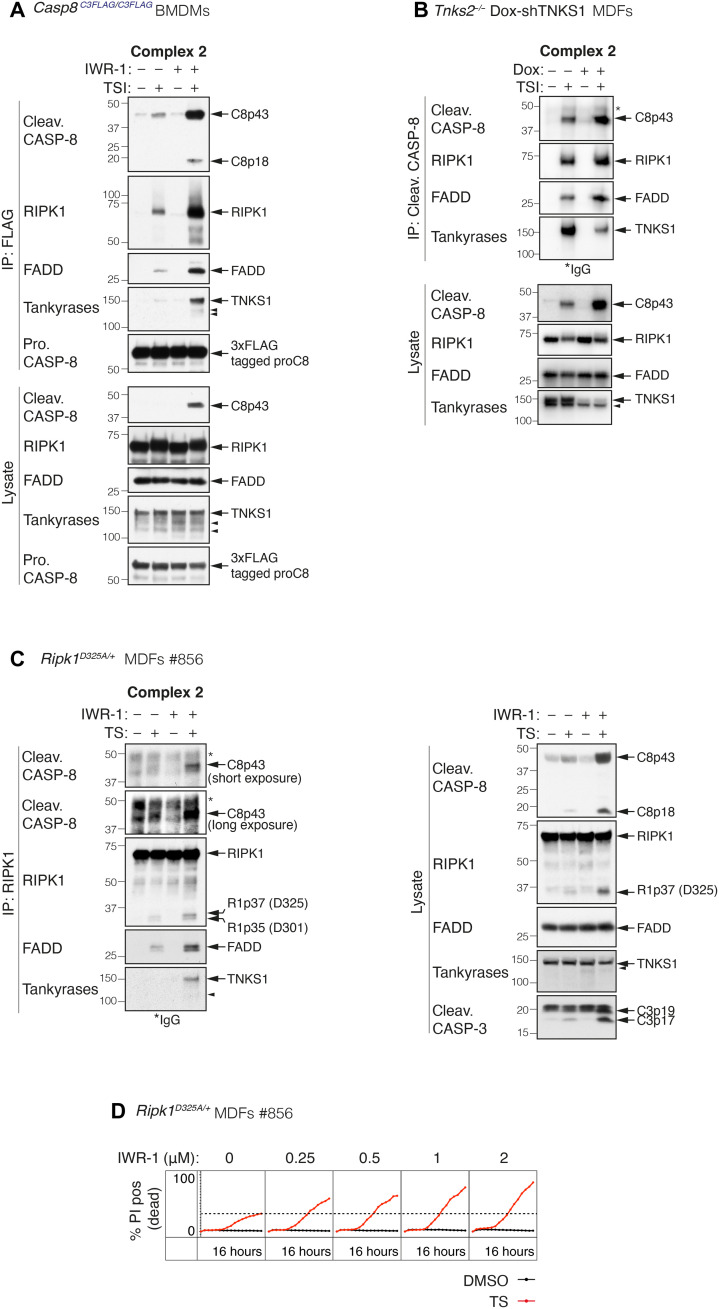
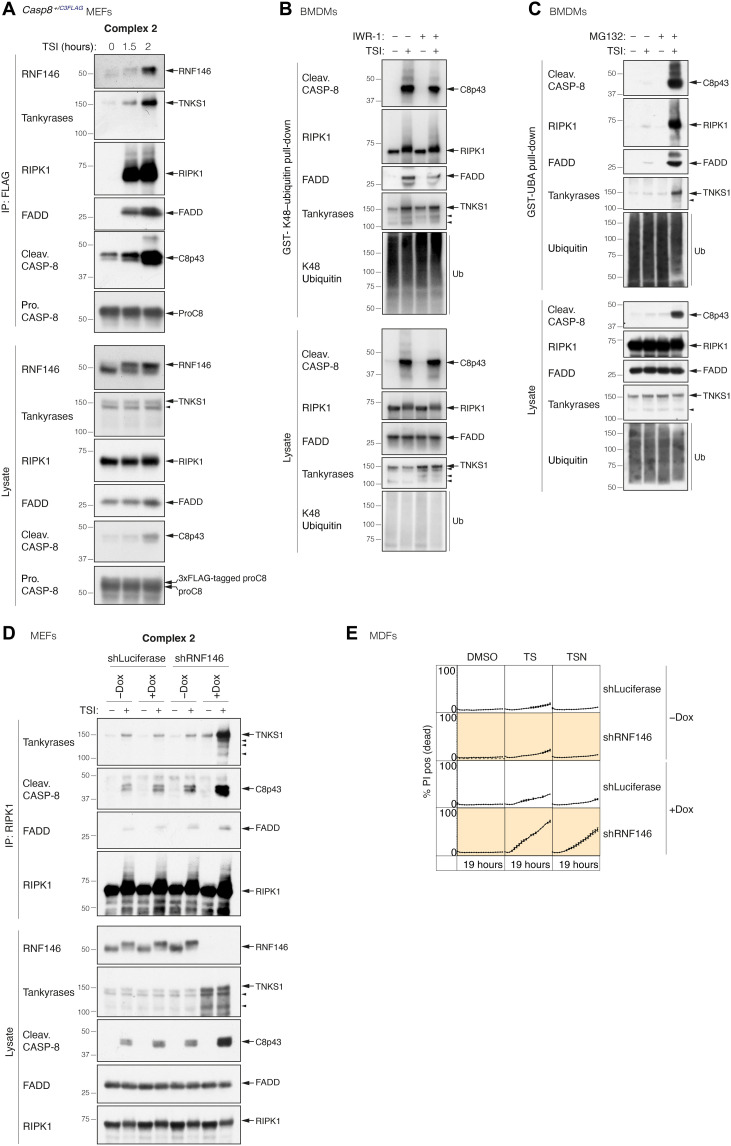
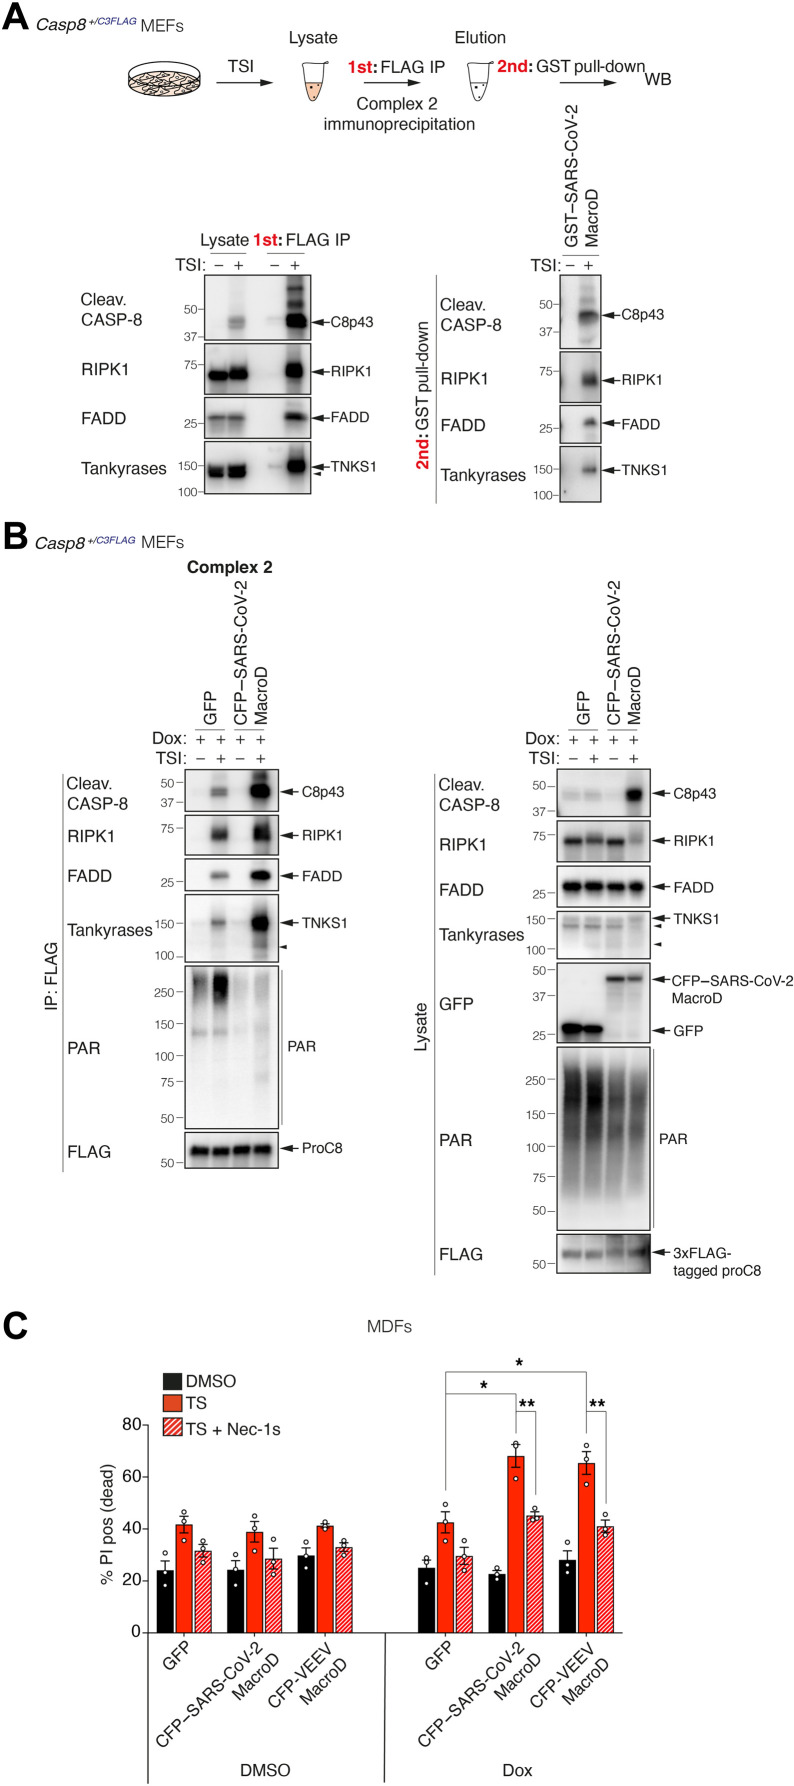
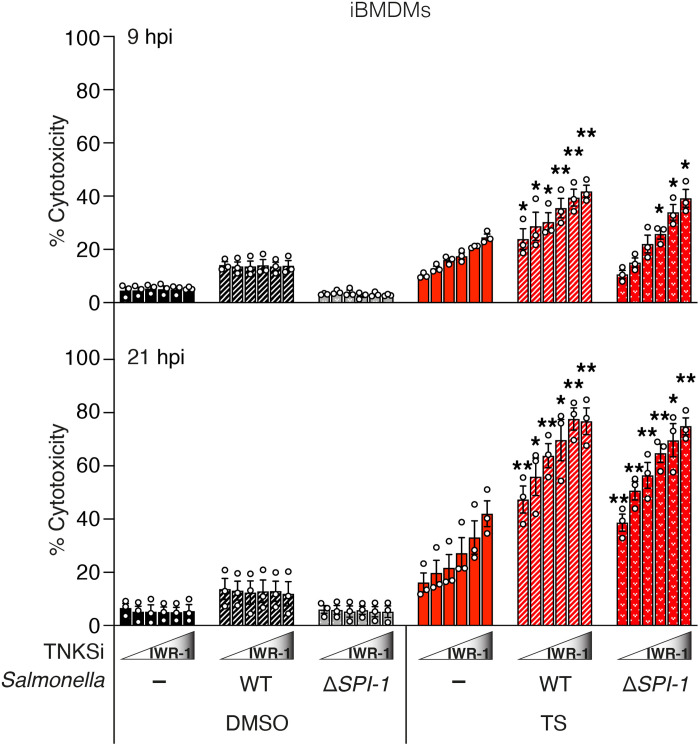
Tumor necrosis factor (TNF) is a key component of the innate immune response. Upon binding to its receptor, TNFR1, it promotes production of other cytokines via a membrane-bound complex 1 or induces cell death via a cytosolic complex 2. To understand how TNF-induced cell death is regulated, we performed mass spectrometry of complex 2 and identified tankyrase-1 as a native component that, upon a death stimulus, mediates complex 2 poly-ADP-ribosylation (PARylation). PARylation promotes recruitment of the E3 ligase RNF146, resulting in proteasomal degradation of complex 2, thereby limiting cell death. Expression of the ADP-ribose-binding/hydrolyzing severe acute respiratory syndrome coronavirus 2 macrodomain sensitizes cells to TNF-induced death via abolishing complex 2 PARylation. This suggests that disruption of ADP-ribosylation during an infection can prime a cell to retaliate with an inflammatory cell death.


Figures

Fig. 1.
Fig. 1.. Tankyrase-1 is an interactor of native TNFR1 complex 2.
(A) Log2 fold change volcano plots of protein enrichment upon TSI stimulation in Casp8−/−Mlkl−/−MDFs expressing caspase-8 C3FLAG compared to the untreated control. Proteins were first filtered by requiring a P < 0.05 in a pairwise comparison between the caspase-8 C3FLAG and tagless caspase-8–negative control in either the untreated or TSI-treated samples. Known constituents of the native TNFR1 complex 2 (RIPK1, RIPK3, FADD, TRADD, and A20) are labeled and highlighted in green, while TNKS1 (TNKS) is highlighted in red. P values are calculated using Limma (n = 5 independent experiments). (B) TNF-induced complex 2 immunoprecipitation using anti-FLAG M2 affinity beads. Casp8+/+, Casp8+/N3FLAG, and Casp8+/C3FLAG BMDMs were treated with TNF (100 ng/ml) + Smac mimetic compound A (500 nM) + caspase inhibitor IDN-6556 (5 μM; TSI) for 1.5 hours before lysis and anti-FLAG immunoprecipitation (IP). FLAG spiked controls contained 3xFLAG peptides at a final concentration of 50 μg/ml. Caspase inhibitor was used to stabilize complex 2. (C to D) TNF-induced complex 2 immunoprecipitation. Wild-type (WT) BMDMs were treated with TSI [as in (B)] to induce complex 2 assembly. Lysates were immunoprecipitated with anti-RIPK1 (C) or anti–cleaved caspase-8 or anti-tankyrase (D), separated on SDS–polyacrylamide gel electrophoresis gels and probed with the indicated antibodies. Filled arrowheads alone denote bands between 100 and 150 kDa detected by anti-tankyrase, which might indicate TNKS1 isoform 2 (106 kDa) or TNKS2 (127 kDa). For detailed domain information, see fig. S1D. * indicate immunoglobulin G (IgG) chains.
Fig. 2.
Fig. 2.. Complex 2 is PARylated.
(A) Anti-FLAG immunoprecipitation of complex 2. Casp8+/C3FLAG MEFs were treated with TNF (100 ng/ml) + Smac mimetic (500 nM) + caspase inhibitor (5 μM; TSI) ± tankyrase inhibitor IWR-1 (10 μM) for 2 hours. (B) Anti-PAR (Trevigen 4335-MC-100) immunoprecipitation of complex 2. WT BMDMs were treated with TSI as in (A) ± tankyrase inhibitor IWR-1 (5 μM) for 1.5 hours. (C) GST-WWE pull-down of stimulated WT BMDMs lysates. Cells were treated with TNF (10 ng/ml) + Smac mimetic (250 nM) + caspase inhibitor (5 μM; TSI) ± tankyrase inhibitor IWR-1 (5 μM) or ± PARP1/2 inhibitor olaparib (1 μM) for 1.5 hours. Ponceau S staining of the purified proteins and their quantities is shown. (D) GST-WWE pull-down of stimulated MEFs lysates. Cells were treated as in (A). (E) Enrichment of PARylated complex 2 using GST-WWE in a sequential pull-down analysis. Casp8C3FLAG/C3FLAG BMDMs were treated with TSI [as in (A)], and complex 2 was immunoprecipitated using anti-FLAG M2 affinity beads. Immunoprecipitants were eluted with 3xFLAG peptides followed by ± PARG treatment at 37°C for 3 hours before GST-WWE pull-down. PAR chains were recognized by anti-PAR [poly/mono–ADP-ribose (E6F6A) rabbit monoclonal antibody no. 83732; CST] (A and C) or anti-PAR (MABC547; Sigma-Aldrich) (B and D). Filled arrowheads alone indicate potential tankyrase species. Double bands around 150 kDa in anti-tankyrase blots indicate full-length TNKS1 (upper band, 150 kDa) and an undefined TNKS1 isoform (lower band). Empty arrowheads alone denote unmodified RIPK1 that is purified nonspecifically by either sepharose anti-PAR (B) or sepharose GST-WWE. * indicate IgG chains.
Fig. 3.
Fig. 3.. Tankyrases protect from TNF-induced cell death.
(A and B) Level of cell death assessed by PI-positive cells. WT BMDMs were treated with TNF (10 ng/ml) + Smac-mimetic (500 nM; TS) for 24 hours (A) or TNF (10 ng/ml) + Smac mimetic (10 nM) + caspase inhibitor (5 μM; TSI) for 16 hours (B) ± IWR-1 (250 and 500 nM and 1, 2, and 5 μM) ± Nec-1 s (10 μM). Graph shows means ± SEM, n = 3 independent BMDMs. (C) Level of cell death assessed by PI-positive cells. WT MDFs or Tnks2−/− MDFs expressing Dox-inducible shRNA were pretreated with ± Dox (1 μg/ml) for 48 hours followed by TNF (50 ng/ml) + Smac mimetic (10 nM; TS) ± Dox (1 μg/ml) for 17 hours. Cell death was quantified by PI uptake using time-lapse imaging (IncuCyte). Percent (%) PI positive (dead) at 17 hours TS treatment was plotted to generate bar graph. Graph shows means ± SEM, n = 4 independent experiments using two independent MDFs. IncuCyte data are shown in fig. S3C. (D and E) Western blot analysis of cell lysates from WT BMDMs using indicated antibodies is shown. Cells were treated with TNF (10 ng/ml) + Smac mimetic (500 nM; TS) (D) or TNF (10 ng/ml) + Smac mimetic (20 nM) + caspase inhibitor (5 μM; TSI) (E) ± IWR-1 (250 and 500 nM and 1, 2, and 5 μM) for 8 hours. Comparisons were performed with a Student’s t test whose values are denoted as *P ≤ 0.05, **P ≤ 0.01, ***P ≤ 0.001, and ****P ≤ 0.0001; n.s., no significance.
Fig. 4.
Fig. 4.. Tankyrases limit complex 2 assembly.
(A) TNF-induced complex 2 immunoprecipitation using anti-FLAG M2 affinity beads. Cells were treated with TNF (10 ng/ml) + Smac mimetic (50 nM) + caspase inhibitor (5 μM; TSI) ± IWR-1 (5 μM) for 1.5 hours. (B) TNF-induced complex 2 immunoprecipitation using anti–cleaved caspase-8 antibody. Tnks2−/− MDFs expressing Dox-inducible shTNKS1 were pretreated with ± Dox (1 μg/ml) for 48 hours followed by TNF (100 ng/ml) + Smac mimetic (250 nM) + caspase inhibitor (5 μM; TSI) for 2 hours. In Tnks2−/− MDFs, we observed two anti-tankyrase bands, one at ~150 kDa and one just below. Our data suggest that they are TNKS1 specific but are not the result of caspase cleavage, and we therefore believe them to be an unreported isoform. (C) TNF-induced complex 2 immunoprecipitation using anti-RIPK1 antibody. Ripk1D325A/+ heterozygous MDFs were treated with TNF (50 ng/ml) + Smac mimetic (100 nM) ± IWR-1 (5 μM) for 2 hours. (D) Cell death monitored by time-lapse imaging (IncuCyte) of PI staining over 16 hours. Ripk1D325A/+ heterozygous MDFs were treated with TNF (50 ng/ml) + Smac mimetic (25 nM; TS) ± IWR-1 for 16 hours. % PI positive (dead) was obtained by normalizing PI count to cell confluency. Dashed line denotes % PI positive (dead) without IWR-1 treatment for reference. Results from two additional independent MDFs are shown in fig. S4C. Filled arrowheads alone indicate potential tankyrase species. Double bands around 150 kDa in anti-tankyrase blots indicate full-length TNKS1 (upper band, 150 kDa) and an undefined TNKS1 isoform (lower band). * indicate IgG chains.
Fig. 5.
Fig. 5.. The tankyrase-RNF146 axis regulates the stability of complex 2 and TNF-induced death.
(A) TNF-induced complex 2 immunoprecipitation using anti-FLAG M2 affinity beads. Casp8+/C3FLAG MEFs were treated with TNF (100 ng/ml) + Smac mimetic (500 nM) + caspase inhibitor (5 μM; TSI) for the indicated time points. (B) GST-K48–ubiquitin pull-down of stimulated WT BMDM lysates. Cells were treated with TSI [as in (A)] for 1.5 hours ± IWR-1 (5 μM). (C) GST-UBA pull-down of stimulated WT BMDMs lysates. Cells were pretreated with ± proteasome inhibitor MG132 (10 μM) for 2 hours, followed by TNF (10 ng/ml) + Smac mimetic (50 nM) + caspase inhibitor (5 μM; TSI) ± MG132 (10 μM) for another 2 hours. (D) TNF-induced complex 2 immunoprecipitation using anti-RIPK1 antibody. WT MEFs expressing GFP-tagged Dox-inducible shLuciferase or shRNF146 were pretreated with ± Dox (1 μg/ml) for 48 hours. Cells were then treated with TSI [as in (A)] ± Dox (1 μg/ml) for another 2 hours. (E) Cell death monitored by time-lapse imaging (IncuCyte) of PI staining. WT MDFs expressing GFP-tagged Dox-inducible shLuciferase or shRNF146 were pretreated with ± Dox (1 μg/ml) for 48 hours, followed by TNF (50 ng/ml) + Smac mimetic (50 nM; TS) ± Dox (1 μg/ml) ± Nec-1 s (10 μM) for another 19 hours. % PI positive (dead) was obtained by normalizing PI count to GFP-positive cells. Graph shows means ± SEM. n = 3 independent MDFs. Filled arrowheads alone indicate potential tankyrase species. Double bands around 150 kDa in anti-tankyrase blots indicate full-length TNKS1 (upper band, 150 kDa) and an undefined TNKS1 isoform (lower band).
Fig. 6.
Fig. 6.. SARS-CoV-2 macrodomain sensitizes TNF-induced death via abolishing complex 2 PARylation.
(A) Enrichment of PARylated complex 2 using GST–SARS-CoV-2 macrodomain in a sequential pull-down analysis. Casp8+/C3FLAG MEFs were treated with TNF (100 ng/ml) + Smac mimetic (500 nM) + caspase inhibitor (5 μM; TSI) for 2 hours, and complex 2 was immunoprecipitated using anti-FLAG M2 affinity beads. Immunoprecipitants were eluted using 3xFLAG peptides followed by GST-SARS-CoV-2 MacroD pull-down. (B) TNF-induced complex 2 immunoprecipitation using anti-FLAG M2 affinity beads. Casp8+/C3FLAG MEFs expressing Dox-inducible GFP or CFP-SARS-CoV-2 macrodomain were pretreated with Dox (10 ng/ml) for 9 hours. Cells were then treated with TSI [as in (A)] in the absence of Dox for another 2 hours, and complex 2 was immunoprecipitated using anti-FLAG M2 affinity beads. (C) Level of cell death assessed by PI-positive cells. WT MDFs expressing Dox-inducible GFP or CFP-SARS-CoV-2 macrodomain or CFP-VEEV macrodomain were pretreated with ± Dox (10 ng/ml) for 9 hours. Cells were then treated with TNF (50 ng/ml) + Smac mimetic (25 nM; TS) ± Nec-1 s (10 μM) in the absence of Dox for another 20 hours, and the amount of cell death was assessed by PI staining and flow cytometry. Graph shows means ± SEM, n = 3 independent MDFs. Comparisons were performed with a Student’s t test whose values are denoted as *P ≤ 0.05 and **P ≤ 0.01. Filled arrowheads alone indicate potential tankyrase species. Double bands around 150 kDa in anti-tankyrase blots indicate full-length TNKS1 (upper band, 150 kDa) and an undefined TNKS1 isoform (lower band).
Fig. 7.
Fig. 7.. Tankyrases protect against the cytotoxic effect of TNF under infection condition.
Level of cytotoxicity assessed by LDH assay. iBMDMs were infected with S. Typhymurium SL1344 WT or ΔSPI-1 (MOI: 2) and treated with TNF (10 ng/ml) + Smac mimetic (250 nM; TS) ± IWR-1 (250 and 500 nM and 1, 2, and 5 μM) at 3 hpi. Cytotoxicity was then assessed by LDH assay of cell supernatants collected at 9 and 21 hpi. Graph shows means ± SEM. n = 3 independent experiments. Comparisons were performed between TS-treated uninfected and S. Typhimurium SL1344 WT or ΔSPI-1-infected cells at each IWR-1 concentration with a Student’s t test whose values are denoted as *P ≤ 0.05 and **P ≤ 0.01.

References

    1. Silke J., The regulation of TNF signalling: What a tangled web we weave. Curr. Opin. Immunol. 23, 620–626 (2011). - PubMed
    1. Annibaldi A., Meier P., Checkpoints in TNF-induced cell death: Implications in inflammation and cancer. Trends Mol. Med. 24, 49–65 (2018). - PubMed
    1. Walczak H., TNF and ubiquitin at the crossroads of gene activation, cell death, inflammation, and cancer. Immunol. Rev. 244, 9–28 (2011). - PubMed
    1. Rahman M. M., McFadden G., Modulation of tumor necrosis factor by microbial pathogens. PLOS Pathog. 2, e4 (2006). - PMC - PubMed
    1. Silke J., Hartland E. L., Masters, marionettes and modulators: Intersection of pathogen virulence factors and mammalian death receptor signaling. Curr. Opin. Immunol. 25, 436–440 (2013). - PubMed