. 2022 Oct 27;140(17):1891-1906.
doi: 10.1182/blood.2021015106.

Therapeutic targeting of LCK tyrosine kinase and mTOR signaling in T-cell acute lymphoblastic leukemia

Affiliations

Therapeutic targeting of LCK tyrosine kinase and mTOR signaling in T-cell acute lymphoblastic leukemia

Saara Laukkanen et al. Blood. .

Abstract

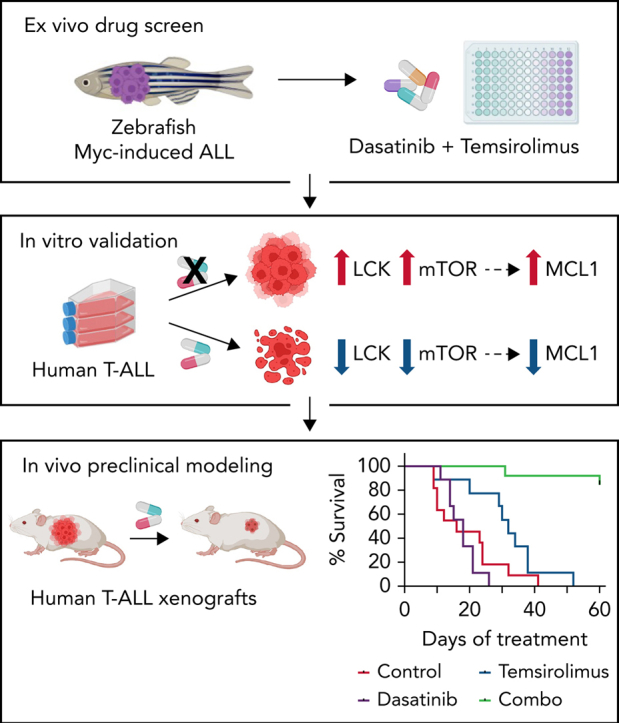
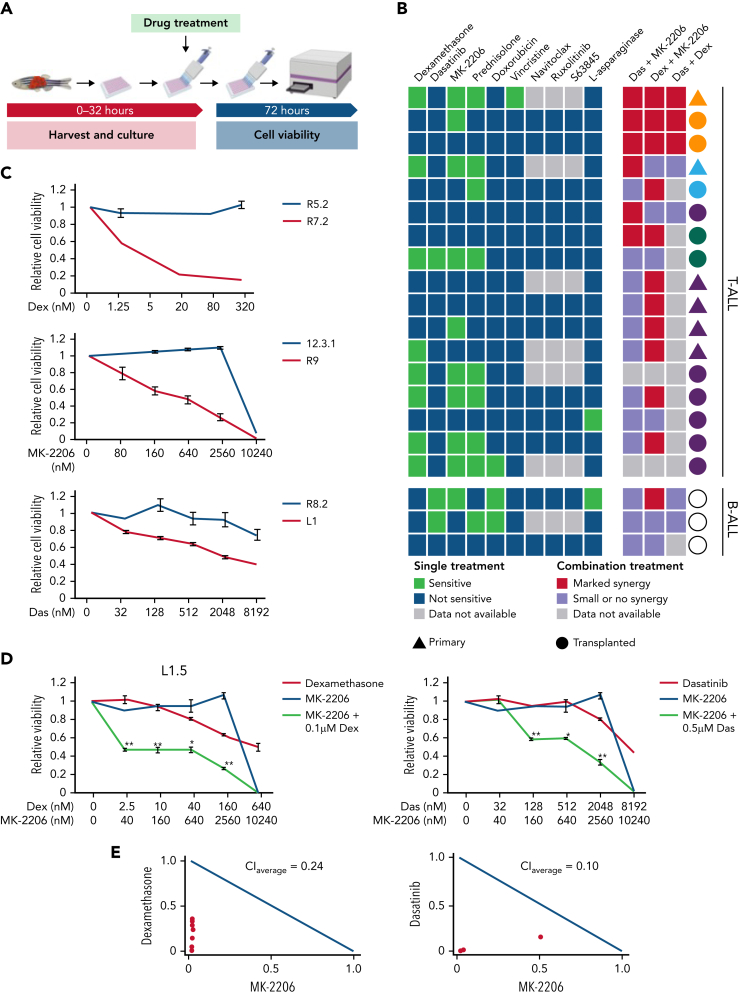
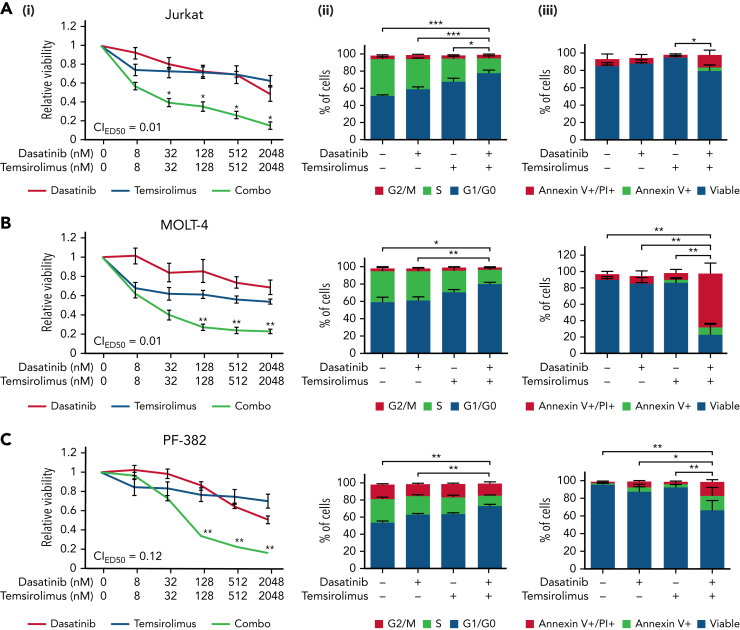
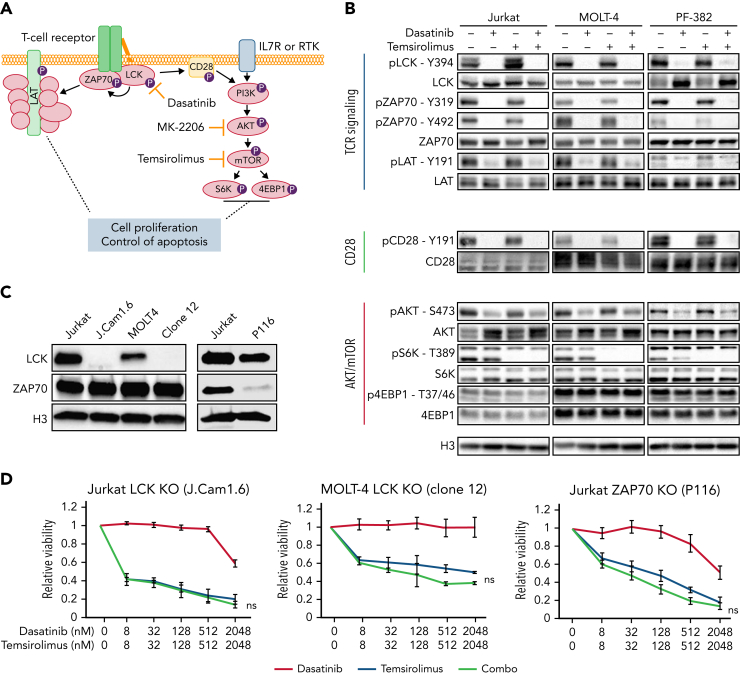
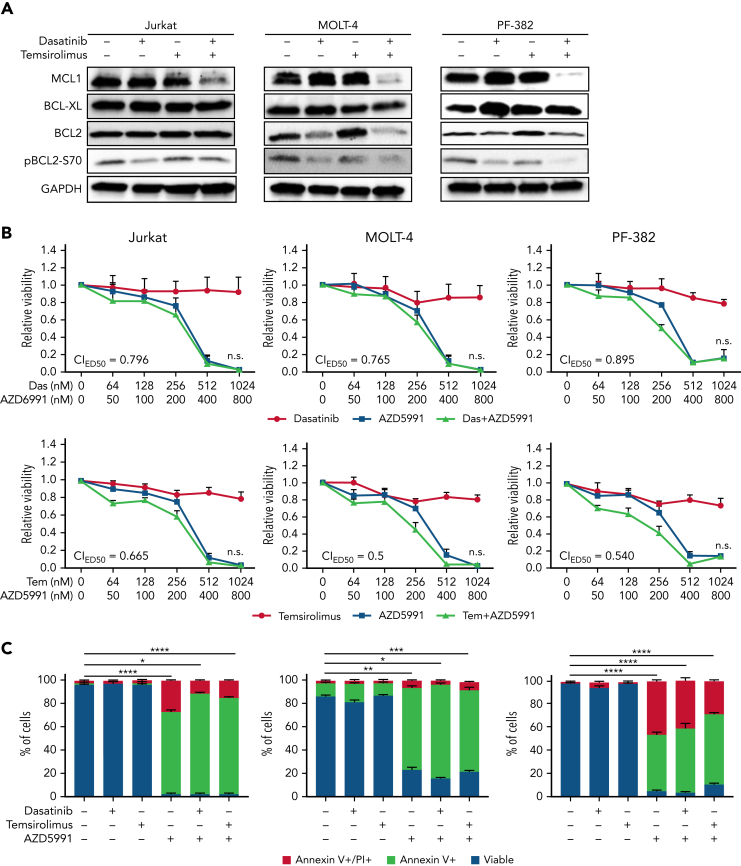
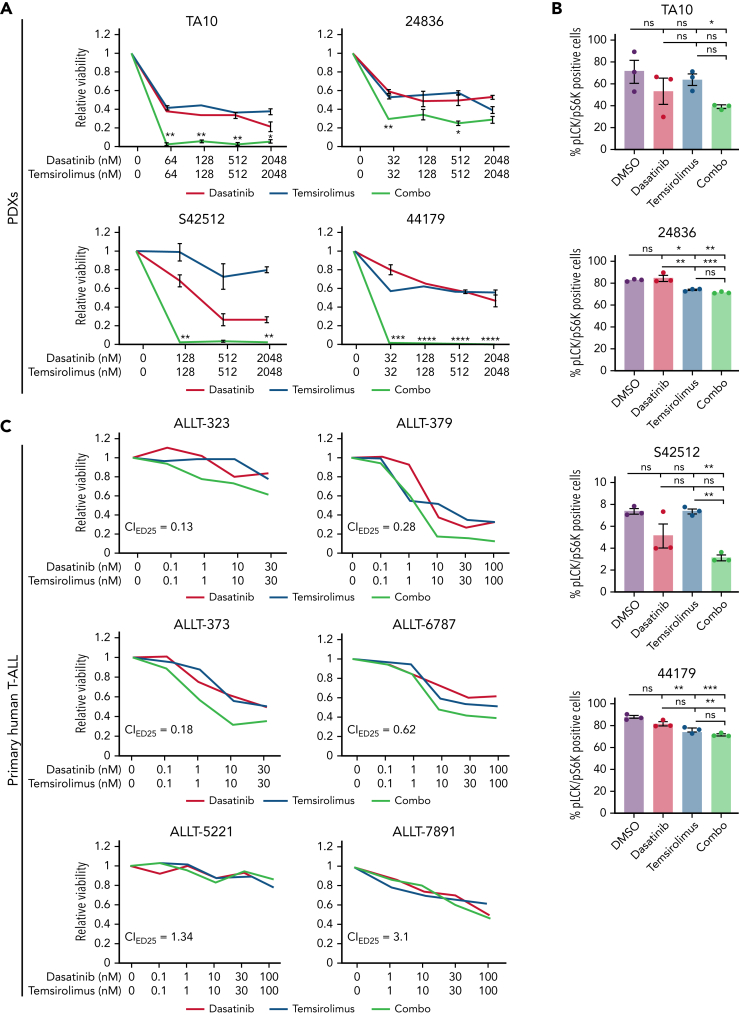
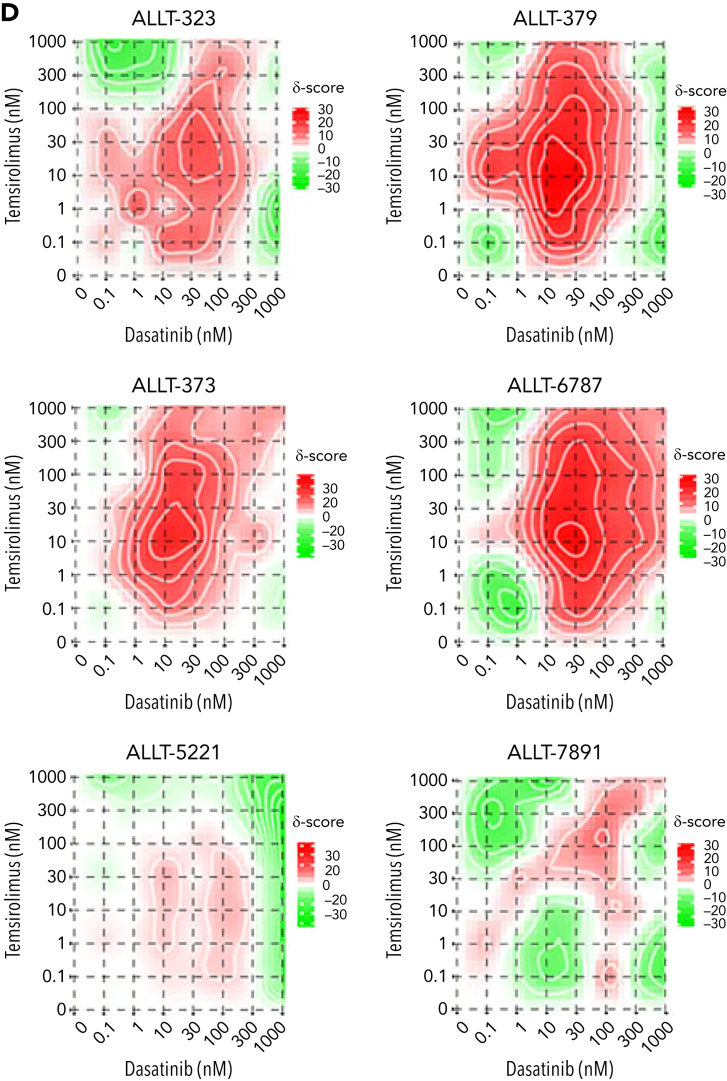
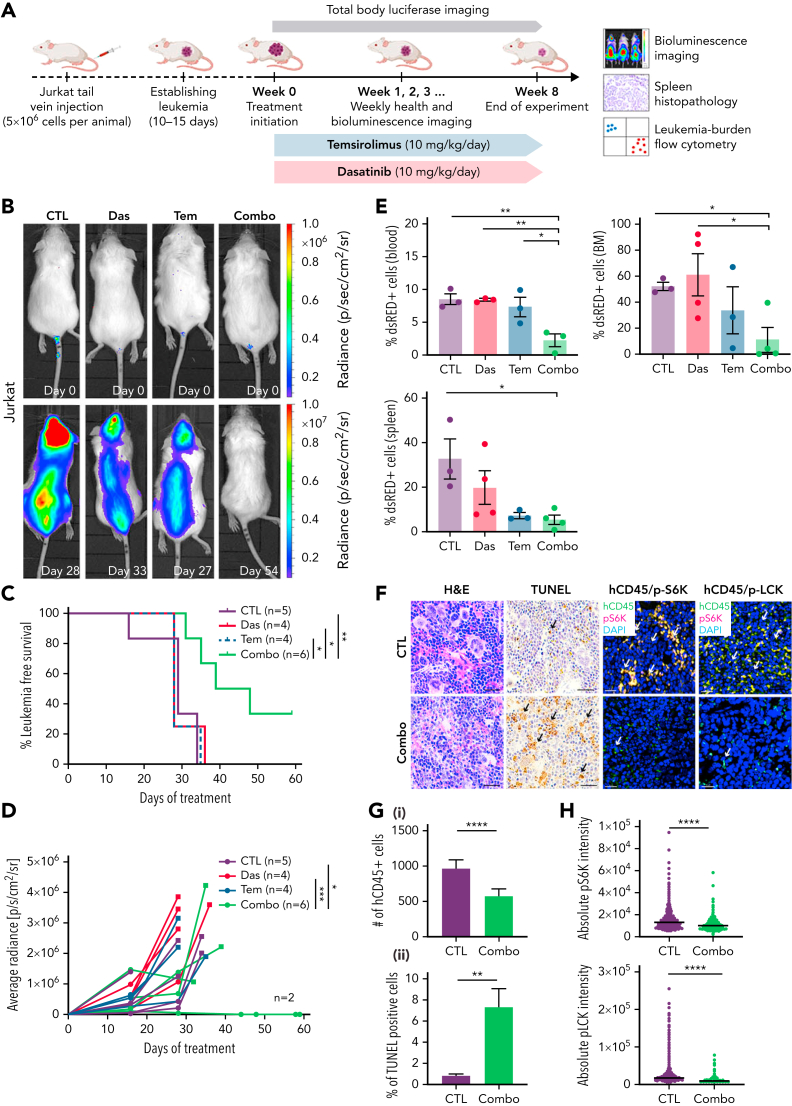
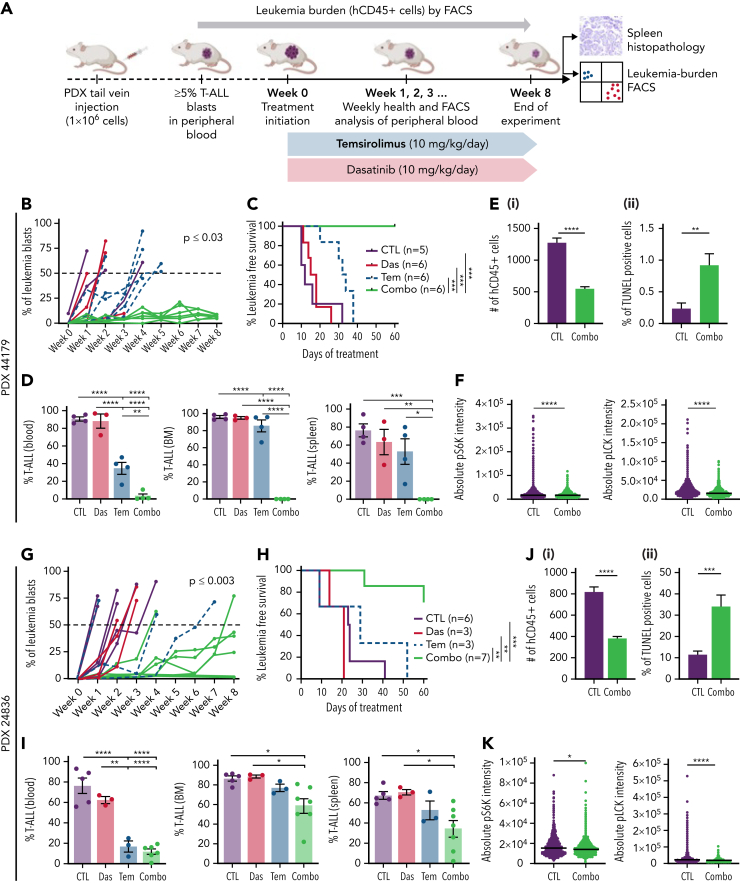
Relapse and refractory T-cell acute lymphoblastic leukemia (T-ALL) has a poor prognosis, and new combination therapies are sorely needed. Here, we used an ex vivo high-throughput screening platform to identify drug combinations that kill zebrafish T-ALL and then validated top drug combinations for preclinical efficacy in human disease. This work uncovered potent drug synergies between AKT/mTORC1 (mammalian target of rapamycin complex 1) inhibitors and the general tyrosine kinase inhibitor dasatinib. Importantly, these same drug combinations effectively killed a subset of relapse and dexamethasone-resistant zebrafish T-ALL. Clinical trials are currently underway using the combination of mTORC1 inhibitor temsirolimus and dasatinib in other pediatric cancer indications, leading us to prioritize this therapy for preclinical testing. This combination effectively curbed T-ALL growth in human cell lines and primary human T-ALL and was well tolerated and effective in suppressing leukemia growth in patient-derived xenografts (PDX) grown in mice. Mechanistically, dasatinib inhibited phosphorylation and activation of the lymphocyte-specific protein tyrosine kinase (LCK) to blunt the T-cell receptor (TCR) signaling pathway, and when complexed with mTORC1 inhibition, induced potent T-ALL cell killing through reducing MCL-1 protein expression. In total, our work uncovered unexpected roles for the LCK kinase and its regulation of downstream TCR signaling in suppressing apoptosis and driving continued leukemia growth. Analysis of a wide array of primary human T-ALLs and PDXs grown in mice suggest that combination of temsirolimus and dasatinib treatment will be efficacious for a large fraction of human T-ALLs.


Conflict of interest statement

Conflict-of-interest disclosure: C.A.H. has received research funding from Celgene, KronosBio, Novartis, Oncopeptides, Orion Pharma, and the IMI2 projects HARMONY and HARMONY PLUS unrelated to this study. All remaining authors declare no competing financial interests.

Figures

None
Graphical abstract
Figure 1.
Figure 1.
Ex vivo drug screening identifies synergies between dasatinib and AKT inhibitor in killing dexamethasone-resistant zebrafish T-ALL. (A) Schematic of experimental design. (B) Comparison of single and combination drug responses in primary (triangles) and transplanted ALL (circles). T-ALL samples are denoted by filled shapes, whereas B-ALL samples are represented as open shapes. Samples with the same color originate from the same primary leukemia (orange, blue, and green). (C) Representative dose-response curves for sensitive (red line) and insensitive ALLs (blue line) to single drug treatment with dexamethasone (Dex), MK-2206, or dasatinib (Das). (D) Dose-response curves following single drug and combination therapy for a representative, transplanted lck:cMyc T-ALL (L1.5). Green line highlights synergistic drug combinations. (E) Isobolograms normalized to the IC50 of each drug. Combination index average (CIaverage) derived from all experimental data points with <1 indicating synergy. Error bars ± standard error of the mean (SEM). n = 3 samples/data point (C-E). ∗P < .05; ∗∗P < .01 by Student 2-tailed t test.
Figure 2.
Figure 2.
Combination of dasatinib and temsirolimus mTOR inhibitor elicit potent cell cycle arrest and leukemia cell killing in human T-ALL. (A) Jurkat. (B) MOLT-4. (C) PF-382. Dose-response curves following single drug and combination therapy (i). Dasatinib and temsirolimus after 72 hours of treatment and assessed by CellTiter-Glo. Combination indexes for ED50 concentrations are shown. Green lines highlight synergistic combination treatments. Cell proliferation assessed by EdU/PI staining (ii). Apoptosis assessed by AnnexinV/PI staining (iii). Error bars ± SEM. n = 3 samples/data point. ∗P < .05; ∗∗P < .01; ∗∗∗P < .001 in comparing single vs combination treated cells (i) or in assessing differences in overall percentages of cells in S-phase or AnnexinV+/PI+ cells by Student 2-tailed t test (ii and iii).
Figure 3.
Figure 3.
Dasatinib inhibits LCK phosphorylation and downstream TCR signaling and induces cell killing when cotreated with temsirolimus. (A) Schematic of TCR and PI3K/AKT/mTOR signaling pathways along with pathway inhibitors. (B) Western blot analysis of T-ALL cells following drug treatment (dasatinib at 100 nM, temsirolimus at 200 nM) for 30 minutes. Representative blot from 3 biological replicates. (C) Western blot showing expression of total LCK and ZAP70 in Jurkat and MOLT-4 wild-type, LCK-deficient (J.Cam1.6 and MOLT-4 clone 12) and ZAP70-deficient (P116) T-ALL cells. Histone H3 (H3) expression used as loading control. (D) Dose-response curves following single drug and combination therapy in LCK- or ZAP70-deficient cells after 72 hours of treatment assessed by CellTiter-Glo. Error bars ± SEM. n = 3 samples/data point. Not significant (ns) by Student 2-tailed t test.
Figure 4.
Figure 4.
Combination dasatinib and temsirolimus inhibits MCL-1 expression. (A) Western blot analysis of Jurkat, MOLT-4, and PF-382 T-ALL cells following drug treatment for 120 hours. Representative blot from 3 biological replicates. GAPDH expression used as loading control. (B) Dose-response curves following single drug and combination therapy. Dasatinib, temsirolimus, and MCL-1 inhibitor AZD5991 after 24 hours of treatment and assessed by CellTiter-Glo. Combination indexes for ED50 concentrations are shown (not significant if ≥0.5). (C) AZD5991 potently kills T-ALL cells after 4 days of treatment. AZD5991 (250 nM), dasatinib (500 nM), and temsirolimus (2 μM). Error bars ± SEM. n = 3 samples/data point. ∗P < .05; ∗∗P < .01; ∗∗∗P < .001; ∗∗∗∗P < .0001 by Student 2-tailed t test.
Figure 5.
Figure 5.
Primary human T-ALL cells are killed by dasatinib and temsirolimus combination treatment. (A-B) Quantification of combination therapy responses in ex vivo treated patient-derived xenograft cells isolated directly from the spleen of leukemic mice. Dose-response curves following 72 hours of therapy treatment (A). Quantification of phosphorylated LCK+/S6K+ T-ALL cells for PDX 42512 and PDX TA10 following 30 minutes of drug treatment or 24 hours for PDX 44179 and PDX 24836 (B). Error bars denote ± standard deviation in panel A and SEM in panel B, n = 3 replicates per data point and green lines denote synergistic combination treatments. ∗P < .05; ∗∗P < .01; ∗∗∗P < .001 by 2-tailed Student t test. Not significant (ns). (C-D) Primary patient samples following ex vivo combination treatment for 48 hours (ALLT-323, ALLT-373, and ALLT-5221) or 72 hours (ALLT-379, ALLT-6787, and ALLT-7891). Dose-response curves with green lines denote synergistic drug responses (C, average across duplicate samples shown). Synergy plots showing responses of drugs over varied dosing (D). Synergy scores were assigned using the Loewe method and significance of >10 denoting marked synergy (ALLT-323, ALLT-379, ALLT-373, and ALLT-6787).
Figure 5.
Figure 5.
Primary human T-ALL cells are killed by dasatinib and temsirolimus combination treatment. (A-B) Quantification of combination therapy responses in ex vivo treated patient-derived xenograft cells isolated directly from the spleen of leukemic mice. Dose-response curves following 72 hours of therapy treatment (A). Quantification of phosphorylated LCK+/S6K+ T-ALL cells for PDX 42512 and PDX TA10 following 30 minutes of drug treatment or 24 hours for PDX 44179 and PDX 24836 (B). Error bars denote ± standard deviation in panel A and SEM in panel B, n = 3 replicates per data point and green lines denote synergistic combination treatments. ∗P < .05; ∗∗P < .01; ∗∗∗P < .001 by 2-tailed Student t test. Not significant (ns). (C-D) Primary patient samples following ex vivo combination treatment for 48 hours (ALLT-323, ALLT-373, and ALLT-5221) or 72 hours (ALLT-379, ALLT-6787, and ALLT-7891). Dose-response curves with green lines denote synergistic drug responses (C, average across duplicate samples shown). Synergy plots showing responses of drugs over varied dosing (D). Synergy scores were assigned using the Loewe method and significance of >10 denoting marked synergy (ALLT-323, ALLT-379, ALLT-373, and ALLT-6787).
Figure 6.
Figure 6.
Combination of dasatinib and temsirolimus inhibit Jurkat T-ALL growth in mouse xenografts. (A) Schematic of experimental design. (B) Representative images of NSG mice engrafted with luciferase+/dsRED2+ Jurkat cells prior to the first day of treatment (day 0) or imaged after treatment on the days noted within each image panel. (C) Kaplan-Meier survival curves. Combination treated mice had significant survival benefit compared with nontreated or monotherapy-treated mice (∗P < .05; ∗∗P < .01, log-rank, Mantel-Cox test). (D) Average radiance of each individual mice measured by bioluminescence. Squares denote the last radiance measurement of moribund animals. Two of 6 combination-treated mice had undetectable leukemia burden at 60 days. ∗P < .05; ∗∗∗P < .001; by Tukey’s post hoc analysis. (E) Quantification of dsRed+ T-ALL cells by flow cytometry analysis of the spleen, bone marrow (BM), and peripheral blood from engrafted mice. Error bars equal ± SEM. ∗P < .05; ∗∗P < .01 by Tukey’s post hoc analysis. (F) Histopathologic analysis of spleens from control and combination therapy-treated mice. Hematoxylin and eosin (H&E), TUNEL, and co-immunohistochemistry for human CD45 (hCD45, FITC) along with either phospho-LCK or phospho-S6K (Alexa Fluor594) and DAPI (blue). Scale bars equal 20 μm. Arrows show representative stained cells. (G) Quantification of IHC analysis of spleens denoting the total number of hCD45 T-ALL cells/3 mm2 across replicates (i) and TUNEL (ii). The average percentage of positive cells ± SEM is noted. (H) Quantification of phospho-LCK or phospho-S6K staining in CD45+ T-ALL cells found in the spleen based on IHC staining. Average intensity is denoted by black bars quantified across >3 animals per condition and 3 sections per spleen. More than 3000 cells were analyzed per condition (G-H). ∗∗P < .01; ∗∗∗∗P < .0001 by Student 2-tailed t test (G-H).
Figure 7.
Figure 7.
Combination of dasatinib and temsirolimus suppresses T-ALL growth in patient-derived xenografts. (A) Schematic of experimental design. (B-F) PDX 441979. (G-K) PDX 24836. (B,G) Leukemia burden assessed by the percentage of CD45+ T-ALL in the peripheral blood of engrafted mice. Combination therapy curbed tumor growth compared with control treated mice. P values denote differences based on 1-way analysis of variance followed by Tukey post hoc test. (C,H) Kaplan-Meier survival curves. (∗P < .05; ∗∗P < .01; ∗∗∗P < .001, log-rank, Mantel-Cox test). (D,I) Flow cytometry quantification of hCD45+ T-ALL cells detected in the spleen, bone marrow (BM), and peripheral blood of engrafted mice at the end of treatment. Error bars equal ± SEM. (E,J) Quantification of spleen sections showing total number of hCD45 T-ALL cells/3 mm2 (i) and TUNEL (ii). Error bars denote ± standard deviation. (F,K) Quantification of phospho-LCK or phospho-S6K staining in CD45+ T-ALL cells found in the spleen based on IHC staining. Average intensity is denoted by black bars quantified across >3 animals per condition and 3 sections per spleen. More than 3000 cells were analyzed per condition. ∗P < .05; ∗∗P < .01; ∗∗∗P < .001; ∗∗∗∗P < .0001; Student 2-tailed t test (D-F,I-K).

References

    1. Hao T, Li-Talley M, Buck A, Chen W. An emerging trend of rapid increase of leukemia but not all cancers in the aging population in the United States. Sci Rep. 2019;9(1) - PMC - PubMed
    1. Van Vlierberghe P, Ferrando A. The molecular basis of T cell acute lymphoblastic leukemia. J Clin Invest. 2012;122(10):3398–3406. - PMC - PubMed
    1. Girardi T, Vicente C, Cools J, De Keersmaecker K. The genetics and molecular biology of T-ALL. Blood. 2017;129(9):1113–1123. - PMC - PubMed
    1. Tremblay CS, Hoang T, Hoang T. Early T cell differentiation lessons from T-cell acute lymphoblastic leukemia. Prog Mol Biol Transl Sci. 2010;92(C):121–156. - PubMed
    1. Gutierrez A, Sanda T, Grebliunaite R, et al. High frequency of PTEN, PI3K, and AKT abnormalities in T-cell acute lymphoblastic leukemia. Blood. 2009;114(3):647–650. - PMC - PubMed

MeSH terms