. 2022 May 6;8(18):eabm9359.
doi: 10.1126/sciadv.abm9359. Epub 2022 May 6.

Interactive effects of climate and land use on pollinator diversity differ among taxa and scales

Affiliations

Interactive effects of climate and land use on pollinator diversity differ among taxa and scales

Cristina Ganuza et al. Sci Adv. .

Abstract

Changes in climate and land use are major threats to pollinating insects, an essential functional group. Here, we unravel the largely unknown interactive effects of both threats on seven pollinator taxa using a multiscale space-for-time approach across large climate and land-use gradients in a temperate region. Pollinator community composition, regional gamma diversity, and community dissimilarity (beta diversity) of pollinator taxa were shaped by climate-land-use interactions, while local alpha diversity was solely explained by their additive effects. Pollinator diversity increased with reduced land-use intensity (forest < grassland < arable land < urban) and high flowering-plant diversity at different spatial scales, and higher temperatures homogenized pollinator communities across regions. Our study reveals declines in pollinator diversity with land-use intensity at multiple spatial scales and regional community homogenization in warmer and drier climates. Management options at several scales are highlighted to mitigate impacts of climate change on pollinators and their ecosystem services.


Figures

Fig. 1.
Fig. 1.. Location and overview of the study sites and study design.
Symbols in the map (Bavaria, Germany) represent our 60 study regions selected along gradients of climate (multiannual mean air temperature 1981–2010) and land-use intensity [seminatural, agricultural, and urban regions—regional land use (RLU)]. Each region contains three plots in open herbaceous vegetation, located in three dominating out of four possible habitat types—forest, grassland, arable land, and settlement. We use the regional scale for analysis of the gamma (γ), intraregional (β¯) and interregional (β) beta diversity, and the local (plot) and landscape (1-km radius around plot) scales for analysis of the alpha (α) diversity. Aerial pictures of regional land-use types were obtained from Google Earth. Photo credit: Cristina Ganuza, Julius-Maximilians-University Würzburg.
Fig. 2.
Fig. 2.. Overlap in species composition among the three major regional land-use types (RLU) and their interaction with multiannual mean temperature (MAT).
Diagrams show ordinations based on NMDS of Jaccard’s dissimilarity matrices. The position of regions (dots, n = 60) in the NMDS space represents the similarity in pollinator community composition in relation to other regions: the closer the dots, the higher the proportion of species shared. Squares represent centroids of the three regional land-use types; polygons delimit the NMDS space occupied by regions with the same regional land-use type; and lines in the background represent contour lines of temperature. The different panels show (A) whole pollinator community, (B) bees, (C) non-bee Hymenoptera, (D) syrphids, (E) non-syrphid Diptera, (F) butterflies, (G) moths, (H) beetles, and (I) flowering plants. Significant effects of MAT, RLU, and their interaction based on permutational multivariate analysis of variance are shown in the top left corner of each panel (table S2). Significance levels: ***P < 0.001, **P < 0.01, and *P < 0.05.
Fig. 3.
Fig. 3.. Response of the gamma, beta, and alpha diversity of the whole pollinator community to land-use variables.
Graphs show predictions of the relationships selected in the best models between (A) gamma and (B) beta diversity (n = 60) and the proportion of forest in the region, and between (C) beta (n = 60) and (D) alpha (n = 175) diversity and the beta and alpha diversity of flowering plants, respectively.
Fig. 4.
Fig. 4.. Differences in alpha diversity of pollinator and flowering-plant communities in the four local habitat types.
Graphs show predictions from the best models (Table 1C), while butterfly alpha diversity and flowering-plant alpha diversity models include habitat as the only explanatory variable. Differences among habitats were calculated via Tukey post hoc tests [function glht from the multcomp package (80)]. Black points indicate means, and bars indicate 95% confidence intervals, while gray points show the raw data. The different panels show (A) whole pollinator community, (B) bees, (C) non-bee Hymenoptera, (D) syrphids, (E) non-syrphid Diptera, (F) butterflies, (G) moths, (H) beetles, and (I) flowering plants. Forest: n = 54, grassland: n = 46, arable land: n = 41, settlement: n = 34. Significance levels: ***P < 0.001, **P < 0.01, and *P < 0.05.
Fig. 5.
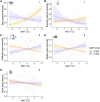
Fig. 5.. Interaction effects between multiannual mean temperature (MAT) and precipitation (MAP).
Graphs show predictions of the interaction terms selected in the best gamma (A and B) and beta (C to E) diversity models (Table 1, A and B; n = 60). Shadows represent 95% confidence intervals, and points show the raw data.
Fig. 6.
Fig. 6.. Interaction effects between MAT and the proportion of regional forest or urban areas.
Graphs show predictions of the interaction terms selected in the best gamma (A) and beta (B and C) diversity models (Table 1, A and B; n = 60). Shadows represent 95% confidence intervals, and data points show the raw data.

Similar articles

Cited by

References

    1. Seibold S., Gossner M. M., Simons N. K., Blüthgen N., Müller J., Ambarlı D., Ammer C., Bauhus J., Fischer M., Habel J. C., Linsenmair K. E., Nauss T., Penone C., Prati D., Schall P., Schulze E.-D., Vogt J., Wöllauer S., Weisser W. W., Arthropod decline in grasslands and forests is associated with landscape-level drivers. Nature 574, 671–674 (2019). - PubMed
    1. van Klink R., Bowler D. E., Gongalsky K. B., Swengel A. B., Gentile A., Chase J. M., Meta-analysis reveals declines in terrestrial but increases in freshwater insect abundances. Science 368, 417–420 (2020). - PubMed
    1. Dainese M., Martin E. A., Aizen M. A., Albrecht M., Bartomeus I., Bommarco R., Carvalheiro L. G., Chaplin-Kramer R., Gagic V., Garibaldi L. A., Ghazoul J., Grab H., Jonsson M., Karp D. S., Kennedy C. M., Kleijn D., Kremen C., Landis D. A., Letourneau D. K., Marini L., Poveda K., Rader R., Smith H. G., Tscharntke T., Andersson G. K. S., Badenhausser I., Baensch S., Bezerra A. D. M., Caballero-Lopez B., Cavigliasso P., Classen A., Cusser S., Dudenhöffer J. H., Ekroos J., Fijen T., Franck P., Freitas B. M., Garratt M. P. D., Gratton C., Hipólito J., Holzschuh A., Hunt L., Iverson A. L., Jha S., Keasar T., Kim T. N., Kishinevsky M., Klatt B. K., Klein A.-M., Krewenka K. M., Krishnan S., Larsen A. E., Lavigne C., Liere H., Maas B., Mallinger R. E., Pachon E. M., Martínez-Salinas A., Meehan T. D., Mitchell M. G. E., Molina G. A. R., Nesper M., Nilsson L., O’Rourke M. E., Peters M. K., Ple M., De L. Ramos D., Rosenheim J. A., Rundlöf M., Rusch A., Sáez A., Scheper J., Schleuning M., Schmack J. M., Sciligo A. R., Seymour C., Stanley D. A., Stewart R., Stout J. C., Sutter L., Takada M. B., Taki H., Tamburini G., Tschumi M., Viana B. F., Westphal C., Willcox B. K., Wratten S. D., Yoshioka A., Zaragoza-Trello C., Zhang W., Zou Y., Steffan-Dewenter I., A global synthesis reveals biodiversity-mediated benefits for crop production. Sci. Adv. 5, eaax0121 (2019). - PMC - PubMed
    1. Ollerton J., Winfree R., Tarrant S., How many flowering plants are pollinated by animals? Oikos 120, 321–326 (2011).
    1. Klein A.-M., Vaissière B. E., Cane J. H., Steffan-Dewenter I., Cunningham S. A., Kremen C., Tscharntke T., Importance of pollinators in changing landscapes for world crops. Proc. R. Soc. B 274, 303–313 (2007). - PMC - PubMed