. 2022 May 6;8(18):eabm8012.
doi: 10.1126/sciadv.abm8012. Epub 2022 May 6.

Innate immune cell response to host-parasite interaction in a human intestinal tissue microphysiological system

Affiliations

Innate immune cell response to host-parasite interaction in a human intestinal tissue microphysiological system

Mouhita Humayun et al. Sci Adv. .

Abstract

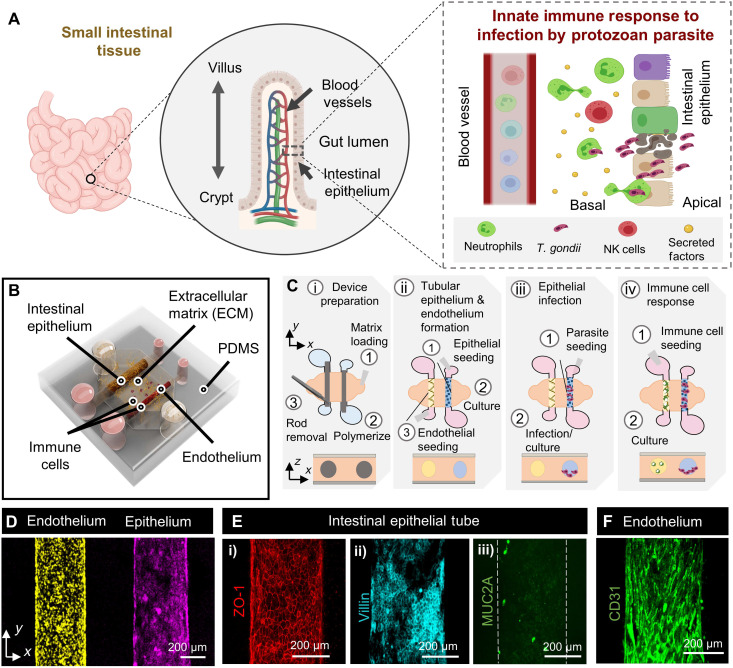
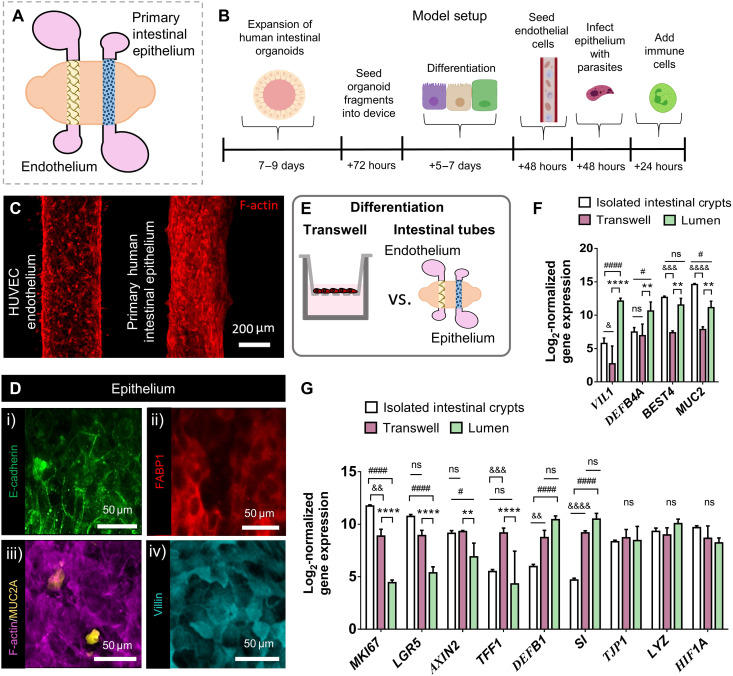
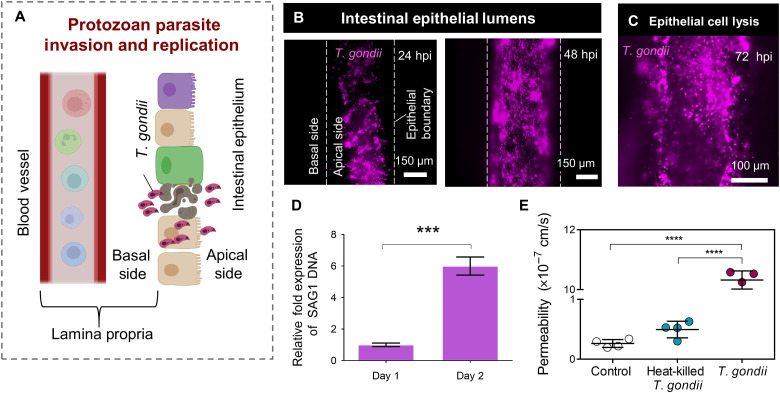
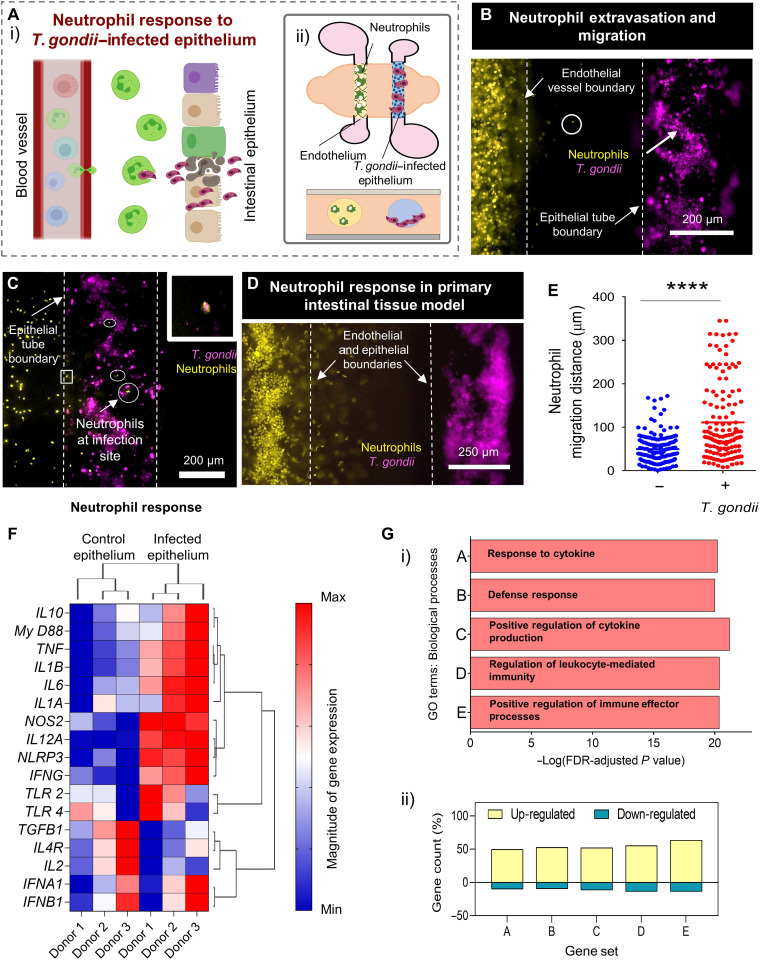
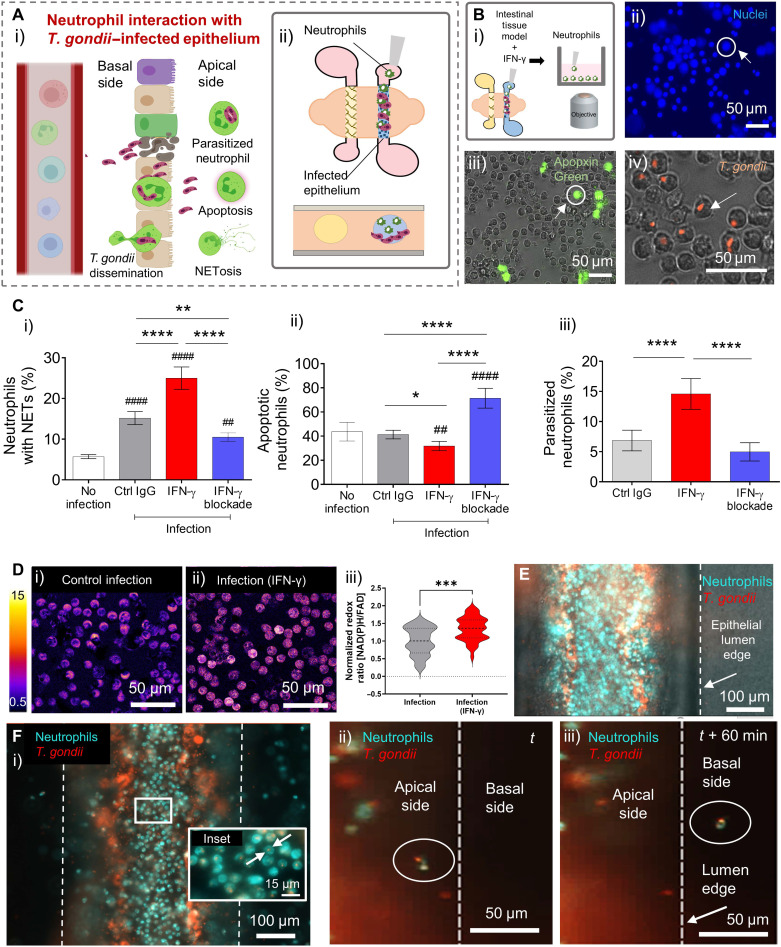
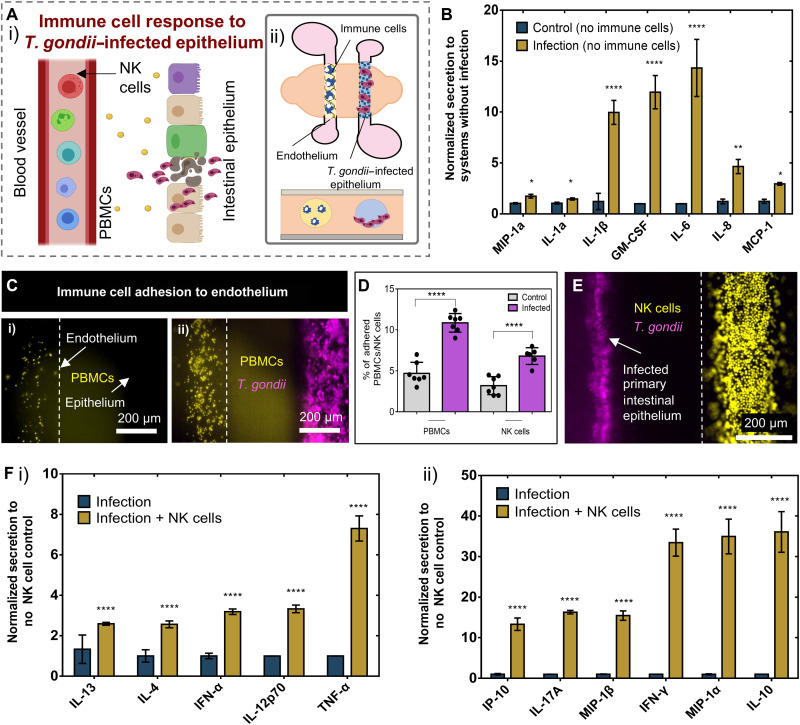
Protozoan parasites that infect humans are widespread and lead to varied clinical manifestations, including life-threatening illnesses in immunocompromised individuals. Animal models have provided insight into innate immunity against parasitic infections; however, species-specific differences and complexity of innate immune responses make translation to humans challenging. Thus, there is a need for in vitro systems that can elucidate mechanisms of immune control and parasite dissemination. We have developed a human microphysiological system of intestinal tissue to evaluate parasite-immune-specific interactions during infection, which integrates primary intestinal epithelial cells and immune cells to investigate the role of innate immune cells during epithelial infection by the protozoan parasite, Toxoplasma gondii, which affects billions of people worldwide. Our data indicate that epithelial infection by parasites stimulates a broad range of effector functions in neutrophils and natural killer cell-mediated cytokine production that play immunomodulatory roles, demonstrating the potential of our system for advancing the study of human-parasite interactions.


Figures

Fig. 1.
Fig. 1.. Human intestinal tissue MPS for studying innate immune responses to parasitic infection.
(A) Schematic representation of the design rationale for modeling parasite infection, in the intestinal epithelium, and innate immune cell responses. (B) Three-dimensional rendered illustration of the intestinal tissue MPS, within a polydimethylsiloxane (PDMS) device that includes tubular intestinal epithelium and endothelium within an ECM gel. Immune cells are introduced into the lumen of the endothelium for modeling and elucidating innate immune responses to parasite infection of the epithelium. (C) Schematic representation describing the experimental approach to set up each component (i to iv) of the MPS used in this study. (D) Fluorescence image showing the formation of a confluent Caco-2 intestinal epithelium (magenta) and HUVEC endothelium (yellow). (E) The model retains phenotypic characteristics of tight junction markers (i, ZO-1), microvilli markers (ii, villin), and markers of mucus producing goblet cells (iii, MUC2A) for the epithelium. (F) HUVEC endothelium in coculture with the epithelium retains expression of endothelial marker (CD31).
Fig. 2.
Fig. 2.. Integrating primary intestinal epithelial cells in the human intestinal tissue MPS.
(A) Schematic showing spatial distribution of the intestinal epithelium and endothelium in the intestinal tissue MPS. (B) Optimized culture protocol and timeline to set up the intestinal tissue MPS. (C) Tubular HUVEC endothelium and primary intestinal epithelium cells as shown by immunostaining of F-actin. (D) Differentiated tubular epithelium shows retention of phenotypic characteristics including expression of epithelial cell adhesion protein (i, E-cadherin), enterocyte-specific marker [ii, fatty acid–binding protein 1 (FABP1)], marker for mucin-producing cells (iii, MUC2A), and marker for protein involved in formation of microvilli (villin 1, iv). (E) Schematic representing the culture and differentiation of human primary intestinal epithelial cells in Transwells and in the intestinal tissue MPS. (F and G) Bar graphs showing differential gene expression in cells isolated from intestinal crypts and in epithelium cultured in the intestinal tissue MPS and Transwells. Genes analyzed include markers associated with the crypt and villus compartment of the intestinal tissue. Values are presented as means ± SD from four independent experiments involving tubular or monolayer epithelium generated from human intestinal organoids (* = Transwell versus lumen, ****P ≤ 0.0001, ***P ≤ 0.001, and **P ≤ 0.01; # = isolated crypts versus lumen, ####P ≤ 0.0001 and #P ≤ 0.05; & = isolated crypts versus Transwell, &&&&P ≤ 0.0001, &&&P ≤ 0.001, &&P ≤ 0.01, and & P ≤ 0.05). ns, not significant.
Fig. 3.
Fig. 3.. Modeling protozoan parasite invasion and replication in the intestinal epithelium.
(A) Schematic representation of epithelial infection by T. gondii. Infection involves epithelial invasion, intracellular replication, and transmigration or epithelial cell lysis of T. gondii, which releases the parasites into the lamina propria containing immune cells and intestinal vasculature. (B) Caco-2 epithelial tubes were infected with mCherry-tagged T. gondii of the ME49 strain for 24 hours and imaged by fluorescence microscopy. The images depict time course images at 24 (i) and 48 hours (ii), showing that viable T. gondii was present within the epithelial lumen. White dashed line represents the epithelial boundary separating apical (lumenal) surface from the basal surface. (C) Fluorescent image depicting epithelial cell lysis 72 hours following infection with mCherry-tagged T. gondii. (D) Relative fold expression of T. gondii genomic DNA in the infected epithelial tubes, quantified at 24 and 48 hpi via qPCR using the SAG1 (T. gondii surface antigen) primer set. Values are presented as means ± SD from two independent experiments and 12 different devices (***P ≤ 0.001). (E) Comparison of dextran (20 kDa) permeability through Caco-2 intestinal epithelium under control and infection by heat-killed T. gondii or live T. gondii conditions. Values are presented as mean permeability + SD (****P ≤ 0.0001).
Fig. 4.
Fig. 4.. Neutrophil response to T. gondii–infected epithelium.
(A) Schematic depicting neutrophil trafficking and interaction with a T. gondii–infected intestinal epithelium as seen in vivo (i) and as modeled in the intestinal tissue MPS (ii). (B) Confocal image showing extravasated neutrophils and their migration toward a T. gondii–infected Caco-2 epithelium. Neutrophils were introduced at 48 hpi and imaged 6 hours after neutrophil seeding. (C) Confocal image showing neutrophils trafficking to the infection site with some neutrophils interacting with the T. gondii–infected epithelium. Inset shows colocalization of neutrophils with T. gondii. Image was taken 24 hours after neutrophil seeding. (D) Confocal image showing neutrophil extravasation and trafficking toward a T. gondii–infected epithelium generated from primary intestinal epithelial cells. Neutrophils were introduced at 72 hpi and imaged 6 hours after neutrophil seeding. (E) Grouped scatter plot showing distance migrated by neutrophils from the endothelium toward T. gondii–infected primary intestinal epithelium. Each dot represents the migration distance of a single neutrophil (****P ≤ 0.0001). (F) Clustergram comparing gene expression in neutrophils from models with T. gondii–infected and control epithelium. Neutrophils from three nondiseased donors were used. Gene expression was analyzed for each donor in both control and infected conditions. The dendrograms at the top indicate relationship among experimental conditions (control and infected) and, on the left of the figures, indicate relationship among genes (high and low expression). (G) The top five most relevant GO terms associated with the analyzed gene set, and their corresponding −log [false discovery rate (FDR)–adjusted P value] (i). The percentage of genes was associated with each GO term according to their fold changes in expression (increase in yellow and decrease in blue) (ii).
Fig. 5.
Fig. 5.. Neutrophil effector functions and contribution to T. gondii dissemination beyond the intestinal epithelium.
(A) Schematic depicting neutrophil responses at the infection site, as seen in vivo (i), and as modeled in the intestinal tissue MPS (ii). (B) Assessment of neutrophil effector functions (i). Immunofluorescence image showing neutrophil nuclei. White circular line highlights neutrophils with decondensed nuclei (ii). Combined bright-field and fluorescence image showing apoptotic neutrophils. White circle highlights an Apopxin Green–positive neutrophil (iii). Combined bright-field and fluorescence image showing parasitized neutrophils. White arrow highlights a neutrophil directly interacting with a T. gondii parasite (iv). (C) Bar graphs showing percentage of neutrophils undergoing NET formation (i), apoptosis (ii), and parasitization (iii), in response to IFN-γ stimulation and blockade. Values are presented as means ± SD of neutrophil response from three nondiseased donors (****P ≤ 0.0001, **P ≤ 0.01, and *P ≤ 0.05; # = versus no infection control, ####P ≤ 0.0001 and ##P ≤ 0.01). IgG, immunoglobulin G. (D) Optical metabolic imaging was used to visualize intracellular NAD(P)H and FAD fluorescence intensities of neutrophils in infected systems without (i) and with IFN-γ stimulation (ii) [redox ratio = NAD(P)H intensity divided by FAD intensity]. Violin plots showing the analysis of neutrophil redox ratio based on NAD(P)H and FAD intensity (iii) (***P ≤ 0.001). (E) Combined bright-field and fluorescence image showing neutrophils within a T. gondii–infected epithelium. (F) Fluorescence image showing some neutrophils with internalized T. gondii after 6-hour coculture with infected epithelium (i). Fluorescence images showing T. gondii trafficking by neutrophils across the epithelial barrier. White dashed line indicates the epithelial boundary separating apical and basal surface (ii and iii).
Fig. 6.
Fig. 6.. Immune cell response and cytokine secretions within the intestinal tissue MPS.
(A) Schematic conceptualization of immune cell response to soluble factor signaling during the initial stages of T. gondii infection, as seen in vivo (i), and as modeled in the intestinal tissue MPS (ii). (B) Cytokine concentrations measured in media collected from the intestinal tissue MPS consisting of endothelial vessel and primary intestinal epithelial tubes infected with T. gondii normalized to control, uninfected systems (****P ≤ 0.0001, **P ≤ 0.01, and *P ≤ 0.05). (C) Fluorescence image showing differences in PBMC adhesion events to the endothelial vessel in control (i) and infected (ii) Caco-2 epithelium. (D) Bar graphs showing percentage of PBMCs and NK cells adhering to the endothelium of control and infected systems following coculture for 2 hours. PBMCs and NK cells were added to the lumen of the endothelial vessel after Caco-2 epithelial infection by T. gondii for 48 hours. Five devices were prepared on two different days for each condition. ****P ≤ 0.0001. (E) Fluorescence image showing T. gondii–infected primary intestinal epithelial tube in coculture with an endothelial vessel containing NK cells. Epithelial tubes were infected for 72 hours before adding NK cells into the endothelial vessel. (F) Cytokine concentrations measured in media collected from infected intestinal tissue MPS consisting of an endothelial vessel, NK cells, and primary intestinal epithelial tubes infected with T. gondii normalized to infected systems without NK cells. In all cytokine measurement experiments, nine devices were prepared on two different days for each paired conditions (infected versus control, and infection in the absence versus presence of NK cells); media from three devices were pooled to make one replicate. Values are presented as means ± SD, ****P ≤ 0.0001.

Similar articles

Cited by

References

    1. Sacks D. L., Vaccines against tropical parasitic diseases: A persisting answer to a persisting problem. Nat. Immunol. 15, 403–405 (2014). - PMC - PubMed
    1. Bigna J. J., Tochie J. N., Tounouga D. N., Bekolo A. O., Ymele N. S., Youda E. L., Sime P. S., Nansseu J. R., Global, regional, and country seroprevalence of Toxoplasma gondii in pregnant women: A systematic review, modelling and meta-analysis. Sci. Rep. 10, 12102 (2020). - PMC - PubMed
    1. Scalise A. A., Kakogiannos N., Zanardi F., Iannelli F., Giannotta M., The blood–brain and gut–vascular barriers: From the perspective of claudins. Tissue Barriers 9, 1926190 (2021). - PMC - PubMed
    1. Buzoni-Gatel D., Schulthess J., Menard L. C., Kasper L. H., Mucosal defences against orally acquired protozoan parasites, emphasis on Toxoplasma gondii infections. Cell. Microbiol. 8, 535–544 (2006). - PubMed
    1. Mestas J., Hughes C. C. W., Of mice and not men: Differences between mouse and human immunology. J. Immunol. 172, 2731–2738 (2004). - PubMed