. 2022 May 17;119(20):e2120870119.
doi: 10.1073/pnas.2120870119. Epub 2022 May 11.

TRPC4 and GIRK channels underlie neuronal coding of firing patterns that reflect Gq/11-Gi/o coincidence signals of variable strengths

Affiliations

TRPC4 and GIRK channels underlie neuronal coding of firing patterns that reflect Gq/11-Gi/o coincidence signals of variable strengths

Jin-Bin Tian et al. Proc Natl Acad Sci U S A. .

Abstract

Transient receptor potential canonical 4 (TRPC4) is a receptor-operated cation channel codependent on both the Gq/11–phospholipase C signaling pathway and Gi/o proteins for activation. This makes TRPC4 an excellent coincidence sensor of neurotransmission through Gq/11- and Gi/o-coupled receptors. In whole-cell slice recordings of lateral septal neurons, TRPC4 mediates a strong depolarizing plateau that shuts down action potential firing, which may or may not be followed by a hyperpolarization that extends the firing pause to varying durations depending on the strength of Gi/o stimulation. We show that the depolarizing plateau is codependent on Gq/11-coupled group I metabotropic glutamate receptors and on Gi/o-coupled γ-aminobutyric acid type B receptors. The hyperpolarization is mediated by Gi/o activation of G protein–activated inwardly rectifying K+ (GIRK) channels. Moreover, the firing patterns, elicited by either electrical stimulation or receptor agonists, encode information about the relative strengths of Gq/11 and Gi/o inputs in the following fashion. Pure Gq/11 input produces weak depolarization accompanied by firing acceleration, whereas pure Gi/o input causes hyperpolarization that pauses firing. Although coincident Gq/11–Gi/o inputs also pause firing, the pause is preceded by a burst, and both the pause duration and firing recovery patterns reflect the relative strengths of Gq/11 versus Gi/o inputs. Computer simulations demonstrate that different combinations of TRPC4 and GIRK conductances are sufficient to produce the range of firing patterns observed experimentally. Thus, concurrent neurotransmission through the Gq/11 and Gi/o pathways is converted to discernible electrical responses by the joint actions of TRPC4 and GIRK for communication to downstream neurons.

Keywords: G proteins; TRP channels; coincidence detection; neuronal firing; neurotransmission.


Conflict of interest statement

The authors declare no competing interest.

Figures

Fig. 1.
Fig. 1.
Electrical stimulation of fi–fx fibers generates TRPC4-dependent plateau depolarization and TRPC4-independent hyperpolarization in LS neurons via metabotropic GABAR and glutamate receptor activation. (A) Diagram (Left) and microscopic picture (Middle) showing the electrical stimulation site and high-frequency burst stimulation protocol (Right); LSc, caudal part of the LS nucleus; VL, lateral ventricle; Stim., stimulating electrode; Rec., recording electrode. The stimulating burst was composed of 10 pulses (100 µs, 0.3 mA per pulse) at 100 Hz. (B) Representative traces of whole-cell current clamp recordings with baseline (prestimulus) potential adjusted to −45 mV for WT (Trpc4+/+, Left) and TRPC4 knockout (Trpc4−/−, Right) LS neurons. Note the appearance of ATPD followed by hyperpolarization (HP) in Trpc4+/+ neurons. Trpc4−/− neurons only responded with a hyperpolarization. Fast neurotransmission was blocked with bicuculline (10 μM), CNQX (15 μM), and d-AP5 (30 μM). The perfusate also contained 4-AP (1 mM) and DHPG (1.3 µM), which facilitated the development of ATPD (SI Appendix, Fig. S1). (CG) Statistics of ATPD area (C), ATPD duration (D), hyperpolarization amplitude (E), hyperpolarization duration (F), and total pause duration (G) for neurons recorded as in B. The “+” sign indicates neurons that developed ATPD. Horizontal bars are means ± SEM of cell numbers shown in parentheses. P values were determined by unpaired t test. (H) Representative trace recorded for a Trpc4+/+ neuron as in B, but the perfusate additionally contained CGP55845 (20 µM) to block GABABRs. (I) ATPD areas before and after the application of CGP55845 for individual neurons connected with dashed lines. Horizontal bars are means ± SEM, and P was determined by paired t test. (J and K) Similar to H and I, but YM298198 (YM; 30 μM) and MPEP (10 μM) were used to block mGluR1/5; mouse age, P21 to P49.
Fig. 2.
Fig. 2.
Costimulation of group I mGluRs and GABABRs in LS neurons evokes a robust TRPC4-dependent ATPD followed by an extended TRPC4-independent hyperpolarization. (A) Diagram for stimulation of LS neurons in brain slices by focal application of receptor agonists near soma and proximal dendrites via pressure ejection. Abbreviations are the same as in Fig. 1A. (BD) Representative traces of whole-cell current clamp recordings with baseline potential adjusted to −45 mV for Trpc4+/+ LS neurons that received ejection of 5 µM DHPG (B), 30 µM baclofen (C), or 5 µM DHPG plus 30 µM baclofen (D, Left). Drugs were ejected for 30 ms (5 to 30 psi) at the time point indicated by vertical arrows. Scale bars have the same values as marked in D (Right). Note the development of ATPD in Trpc4+/+ neurons only when DHPG and baclofen were coapplied and the long hyperpolarization (∼8 s) immediately after ATPD. Inset, expanded trace at the start of ATPD showing burst firing. (Scale bars, 5 ms, 20 mV.) However, coejection of DHPG and baclofen only caused hyperpolarization in Trpc4−/− neurons (D, Right). (EH) Statistics of MP change (E), ATPD duration (F), hyperpolarization (HP) duration (G), and total pause duration (H) for neurons recorded as in B to D plus the effects of GABABR antagonist CGP55845 (CGP; 20 µM) and mGluR1/5 antagonists YM298198 (YM; 30 μM) plus MPEP (10 μM) on the responses evoked by coejection of DHPG and baclofen. Horizontal bars are means ± SEM of cell numbers shown in parentheses. P values were determined by one-way ANOVA followed by Tukey’s test; mouse age, P28 to P60.
Fig. 3.
Fig. 3.
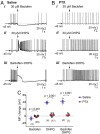
i/o dependence of strong TRPC4 activation (ATPD) in LS neurons. (A and B) Representative traces of whole-cell current clamp recordings of LS neurons in brain slices prepared from WT mice that received intraventricular injections of either saline (A) or PTX (0.3 µg/3 µL; B). The LS neurons were injected with a constant current to adjust their prestimulus potential to −45 mV and received pressure ejection of either 30 μM baclofen (i), 30 μM DHPG (ii), or 5 μM DHPG and 30 μM baclofen (iii) at the time point indicated by the downward arrow. Note that with the blockade of Gi/o signaling by PTX, the hyperpolarization responses, reflective of GIRK channel activity, elicited by baclofen alone (B, i) and baclofen plus DHPG (B, iii) were no longer detected. More importantly, PTX blocked not only the induction of ATPD by baclofen plus DHPG (B, iii) but also that by 30 μM DHPG alone (B, ii), suggesting the involvement and critical role of Gi/o signaling in ATPD induction (strong TRPC4 activation) when only DHPG (10 to 200 µM; see ref. 10) was applied. (C) Statistics of maximal MP changes (either depolarization or hyperpolarization) under the conditions in A and B. Horizontal bars are means ± SEM of cell numbers shown in the parentheses, with P values determined by unpaired t test; mouse age, P35 to P49.
Fig. 4.
Fig. 4.
The relative strength of Gq/11 and G i/o inputs to LS neurons is encoded as firing patterns. (A and B) Two distinct firing patterns recorded with baseline potential adjusted to −45 mV (Left) and the corresponding time courses of firing recovery (Right) of WT LS neurons that received ejection of 30 µM DHPG (A) or 5 µM DHPG plus 30 µM baclofen (B). Downward arrows indicate the time of drug ejection. Brackets below the trace show the periods of ATPD and total firing pause. Right-directed arrows indicate the start of firing recovery, from which IFR were normalized to the mean IFR of the same cell before the drug ejection (indicated by the dashed line and expressed as 1). The solid line is the exponential fit of the normalized IFR. (CE) Comparisons of durations of firing pause (C) and ATPD (D) as well as magnitudes of IFR changes during firing recovery from the pause (E) of LS neurons that received combined stimulation of different concentrations of DHPG and baclofen. Pause (nonfiring period) duration (C) includes ATPD and hyperpolarization. Horizontal bars are means ± SEM of cell numbers shown in the parentheses, with P values determined by one-way ANOVA followed by Tukey’s test; mouse age, P28 to P60.
Fig. 5.
Fig. 5.
Computational simulation replicates electrophysiological recordings of TRPC4- and GIRK-mediated MP waveforms and firing pattern changes. (A) Typical traces of whole-cell current clamp recordings with baseline potential adjusted to −45 mV from LS neurons representing the main classes of MP and firing pattern changes triggered by either pure (or predominant) Gq/11 (Q) or Gi/o (I) stimulation or coincident Gq/11 and Gi/o stimulations of varying strengths. For simplicity, capital and lowercase letters are used to represent strong and weak inputs, respectively. (B) Simulated firing patterns generated by varying TRPC4 and GIRK conductance densities (g¯TRPC4 and g¯GIRK values indicated on the Right in mS/cm2). (C) Hypothetical models depicting the effects of Gi/o–Gq/11 costimulation on g¯TRPC4 (Left) and g¯GIRK (Right). Colored circles highlight conditions simulated in B. (D) IFR plotted against time for simulations in B, highlighting the distinctive patterns (P1 to P5) characterized by the presence or absence of a burst and a pause, pause duration, and IFR recovery patterns (decelerating versus accelerating). (E) Effect of g¯TRPC4 and g¯GIRK on the simulated firing pattern. A 20-by-20 grid search was performed by varying g¯GIRK and g¯TRPC4. The resulting patterns were classified using the same color code as in B to D into P1 (red), P2 (orange), P3 (cyan), P4 (green), and P5 (gray) according to the classification scheme in SI Appendix, Fig. S6A. (F) Effect of g¯TRPC4 and g¯GIRK on pause duration. For every combination of g¯GIRK and g¯TRPC4 in E, IFR was plotted against time, and the longest ISI was plotted in the heat map.

Similar articles

Cited by

References

    1. Betke K. M., Wells C. A., Hamm H. E., GPCR mediated regulation of synaptic transmission. Prog. Neurobiol. 96, 304–321 (2012). - PMC - PubMed
    1. Wiegert J. S., Mahn M., Prigge M., Printz Y., Yizhar O., Silencing neurons: Tools, applications, and experimental constraints. Neuron 95, 504–529 (2017). - PMC - PubMed
    1. Huang C. L., Feng S., Hilgemann D. W., Direct activation of inward rectifier potassium channels by PIP2 and its stabilization by Gβγ. Nature 391, 803–806 (1998). - PubMed
    1. Zhang H., He C., Yan X., Mirshahi T., Logothetis D. E., Activation of inwardly rectifying K+ channels by distinct PtdIns(4,5)P2 interactions. Nat. Cell Biol. 1, 183–188 (1999). - PubMed
    1. Lüscher C., Slesinger P. A., Emerging roles for G protein-gated inwardly rectifying potassium (GIRK) channels in health and disease. Nat. Rev. Neurosci. 11, 301–315 (2010). - PMC - PubMed

Publication types

MeSH terms

Substances

LinkOut - more resources