. 2022 Jun 20;5(6):2643-2663.
doi: 10.1021/acsabm.2c00109. Epub 2022 May 11.

Mass Spectrometry, Structural Analysis, and Anti-Inflammatory Properties of Photo-Cross-Linked Human Albumin Hydrogels

Affiliations

Mass Spectrometry, Structural Analysis, and Anti-Inflammatory Properties of Photo-Cross-Linked Human Albumin Hydrogels

Shahriar Sharifi et al. ACS Appl Bio Mater. .

Abstract

Albumin-based hydrogels offer unique benefits such as biodegradability and high binding affinity to various biomolecules, which make them suitable candidates for biomedical applications. Here, we report a non-immunogenic photocurable human serum-based (HSA) hydrogel synthesized by methacryloylation of human serum albumin by methacrylic anhydride (MAA). We used matrix-assisted laser desorption ionization-time-of-flight mass spectrometry, liquid chromatography-tandem mass spectrometry, as well as size exclusion chromatography to evaluate the extent of modification, hydrolytic and enzymatic degradation of methacrylated albumin macromer and its cross-linked hydrogels. The impacts of methacryloylation and cross-linking on alteration of inflammatory response and toxicity were evaluated in vitro using brain-derived HMC3 macrophages and Ex-Ovo chick chorioallantoic membrane assay. Results revealed that the lysines in HSA were the primary targets reacting with MAA, though modification of cysteine, threonine, serine, and tyrosine, with MAA was also confirmed. Both methacrylated HSA and its derived hydrogels were nontoxic and did not induce inflammatory pathways, while significantly reducing macrophage adhesion to the hydrogels; one of the key steps in the process of foreign body reaction to biomaterials. Cytokine and growth factor analysis showed that albumin-based hydrogels demonstrated anti-inflammatory response modulating cellular events in HMC3 macrophages. Ex-Ovo results also confirmed the biocompatibility of HSA macromer and hydrogels along with slight angiogenesis-modulating effects. Photocurable albumin hydrogels may be used as a non-immunogenic platform for various biomedical applications including passivation coatings.

Keywords: albumin; hydrogels; inflammatory pathways; mass spectrometry; non-immunogenic; photocurable gels; structural analysis.


Conflict of interest statement

Competing interests

Morteza Mahmoudi discloses that (i) he is a co-founder and director of the Academic Parity Movement (www.paritymovement.org), a non-profit organization dedicated to addressing academic discrimination, violence and incivility; (ii) he is a Founding Partner at Partners in Global Wound Care (PGWC); and (iii) he receives royalties/honoraria for his published books, plenary lectures, and licensed patent. The author declares no conflicts of interest.

Figures

Figure 1.
Figure 1.
A: Schematic depiction of the reaction of HSA with methacrylic anhydride. Middle-left: The amino acid sequences of HSA and the distribution of five amino acids, lysine (59), threonine (29), cysteine (35), serine (28), and tyrosine (19), in HSA. B: The crystal structure of HSA with lysine residues and the solvent accessibility of Lys residues in HSA sequence. About 20% of the lysine residues usually have no solution access. C: HSA structure was rendered based on PDB file 1AO6. D: The possible reaction of four amino acids in HSA (threonine, cysteine, serine, and tyrosine) with MAA is shown.
Figure 2.
Figure 2.
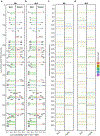
Pine plots summarizing and visualizing the methacryloylation sites along the proteins’ sequence identified with high confidence using GluC and trypsin digestion for M9 (a) and M10 (b). The green and pink branches represent sites identified with GluC and trypsin digestion, respectively. The number on the branches denotes the Lys residue position in the protein. The blue branches are those identified also on unmodified HSA and are thus considered false positive modifications. The Y axis shows the modified residues along the protein sequence, while the X axis represents the solvent accessibility of Lys on a scale of 1 (least accessible) to 5 (most accessible) based on crystal structure. c and d) the methacryloylation sites identified with high confidence on Lys, Cys, Thr, Ser and Tyr along the proteins’ sequence. The colors represent the amino acid residues, and the x axis scale is irrelevant in these two panels.
Figure 3.
Figure 3.
SEC spectra of HSA and HSAMA. The picture insert shows the calibration standard and calibration curve used for calculating the molecular weight of HSA and HSAMA. The values of Vt and V0 for the used column were 24 and 5.5, respectively.
Figure 4.
Figure 4.
A, C) The swelling behavior of the HSAMA hydrogel at two different concentrations of 18 and 15% w/w in water (n=5). B, The prepared hydrogel is shown. Left: The hydrogel made from 11% w/w HSAMA has a soft consistency. Right: The hydrogel made from 15% w/w HSAMA. D) The SEC chromatogram of pure HSA and HSAMA monomer and chromatogram of the sol fraction after extraction of photocrosslinked samples in water is shown in red.
Figure 5.
Figure 5.
The microstructure of the HSAMA hydrogels at three different concentrations: 11, 15, and 18 % w/w (from left to right). The synthesized samples were dried using a critical point dryer, and their structure was studied by SEM. The scale bar is 100 micrometers for SEM picture and 2.3 mm for as-prepared hydrogels.
Figure 6.
Figure 6.
Analysis of degradation products of HSA, HSAMA, and their hydrogels in both aqueous and enzymatic solution. A) weight reduction of water-swollen albumin hydrogel in enzymatic solution is shown (n=5). Samples were pre-extracted in water to remove the sol fraction before the degradation study. B) The protein content of the degradation medium for study groups in water and the presence of the enzyme are shown within the course of the study (n=3). C) The SEC chromatogram of degradation products of HSA and HSAMA in the presence of trypsin. The insert shows the SEC chromatogram of pure HSA and HSAMA. D) The SEC chromatogram of the supernatants from degradation medium of hydrogels (crosslinked HSAMA) in the presence and absence of trypsin. There is a statistically significant difference (p<0.05) in the groups identified by asterisks.
Figure 7.
Figure 7.
A, B: Toxicity of the HSA and HSAMA macromers and the corresponding hydrogels as determined by MTT test. A) Following crosslinking, hydrogels were extracted at 0.2 g/mL in complete cell culture medium for 24 h at 37 °C. The preattached HMC3 cells were then treated with the extract in serial dilution with complete cell culture medium. B) The HSA and HSAMA macromers were added at different concentrations to pre-attached HMC3 cells. The toxicity of gelMA macromer at a concentration of 10 mg/mL was also evaluated. C: The morphology of the HMC3 macrophages after treating with HSA and HSAMA macromer at three concentrations of 5, 10, and 20 mg/mL for 24 h was assessed by confocal laser microscopy. The initial cell density of 2×10⁴ cell/well was used, and images were obtained at 10X and 120X. The actin filaments were stained with Phalloidin-iFluor 488 (green color), and the nucleus was stained with DAPi (blue). The top three rows show the HMC3 cells treated with both HSA and HSAMA at concentrations of 5, 10, and 20 mg/mL, respectively. For the negative control, cells were only seeded on the chamber slide. For the positive controls, water was added to fully attached cells. Scale bar represents 100 micrometers for the first two pictures in each row. For the next two images in each row, the scale represents 5 micrometers.
Figure 8.
Figure 8.
Morphology of HMC3 cells grown on the surface of albumin hydrogels as well as glass slides after 1-, 3- and 5-day culture as revealed by confocal microscope. The actin filament of the HMC3 cells was stained with Phalloidin-iFluor 488 (shown in green), and the nucleus was stained with Nuc650, a fluorescent DNA nuclear stain (shown in pink). The albumin hydrogels absorbed Nuc65, and the nucleus on the surface of the hydrogel could not be detected. The right two pictures in each row (Day 1, 3, and 5) show the cells on the hydrogels. The left three pictures in each row show the actin filament, the merger of the actin filament and nucleus, and only the nucleus, respectively. The scale bars represent 100 micrometers.
Figure 9.
Figure 9.
Cell morphology analysis for HMC3 cells grown on the surface of the albumin hydrogel. (A) The relative spreading area of the cells on the surface of the hydrogels and glass slide after 1, 3, and 5 days’ culture. (B) The average perimeter of the HMC3 cells after 1, 3, and 5 days’ culture on the surface of albumin hydrogels (C) Average Feret’s diameter of HMC3 cells cultured on the hydrogel and glass slides. The image was analyzed by Fiji ImageJ. (D) Filopodia filament visualization on albumin hydrogels on day 5. Visualization was conducted using FilaQuant, FIJI. The value represents mean ± standard deviation for HMC3 cells of (165
Figure 10.
Figure 10.
The inflammatory response of the HMC3 macrophages to HSAMA macromer and resulting hydrogels. For each group, the differential amount is shown next to the picture. The cells were cultured for 24 h. A: The amount of 45 cytokines produced in the media of the cells growing on the surface of the hydrogel and control group is shown. The concentration of IL6 and IL8 is clearly reduced in the hydrogel groups. B: The diffrential cytokins amount between the cells grown on TC and cells on the hydrogels C:The amount of 45 cytokines produced in the culture medium after the addition of 5mg/mL of HSA and HSAMA. D The diffrential cytokins amount between the cells grown in presnese of HAS and HSAMA TC: Tissue culture
Figure 11.
Figure 11.
A: Microscopic images of CAM treated with PBS, HSAMA gel, and HSAMA solution. B: Percentage of the vessels’ area, total vessel length, and mean lacunarity. C: Percentage changes of the angiogenesis parameters. Data are represented as mean ± SD, p* < 0.05. Magnification: 20X. EA: EA: exposed area.

Similar articles

Cited by

References

    1. Drury JL; Mooney DJ, Hydrogels for tissue engineering: scaffold design variables and applications. Biomaterials 2003, 24 (24), 4337–4351. - PubMed
    1. El-Sherbiny IM; Yacoub MH, Hydrogel scaffolds for tissue engineering: Progress and challenges. Glob Cardiol Sci Pract 2013, 2013 (3), 316–342. - PMC - PubMed
    1. Mantha S; Pillai S; Khayambashi P; Upadhyay A; Zhang Y; Tao O; Pham HM; Tran SD, Smart Hydrogels in Tissue Engineering and Regenerative Medicine. Materials (Basel) 2019, 12 (20), 3323. - PMC - PubMed
    1. Gyles DA; Castro LD; Silva JOC; Ribeiro-Costa RM, A review of the designs and prominent biomedical advances of natural and synthetic hydrogel formulations. European Polymer Journal 2017, 88, 373–392.
    1. Madduma-Bandarage USK; Madihally SV, Synthetic hydrogels: Synthesis, novel trends, and applications. Journal of Applied Polymer Science 2021, 138 (19), 50376.

Publication types

MeSH terms

LinkOut - more resources