. 2022 Jul 13;30(7):1034-1047.e6.
doi: 10.1016/j.chom.2022.04.008. Epub 2022 May 10.

Persisting uropathogenic Escherichia coli lineages show signatures of niche-specific within-host adaptation mediated by mobile genetic elements

Affiliations

Persisting uropathogenic Escherichia coli lineages show signatures of niche-specific within-host adaptation mediated by mobile genetic elements

Robert Thänert et al. Cell Host Microbe. .

Abstract

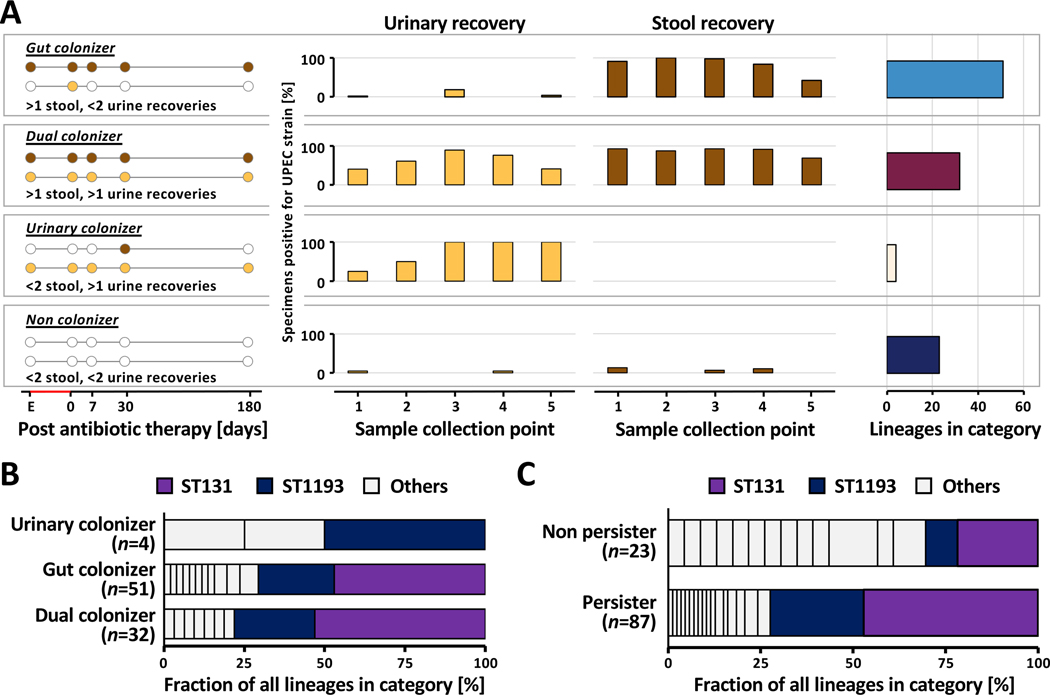
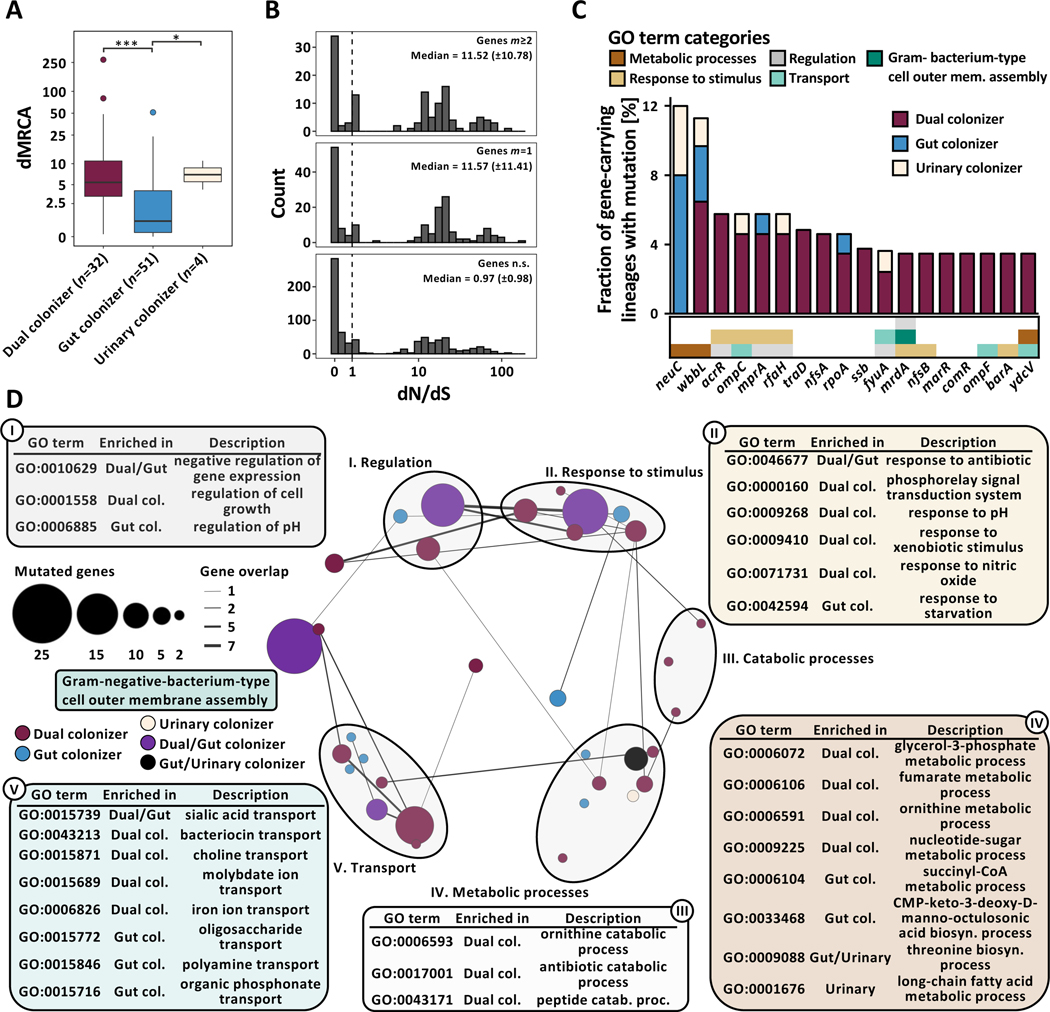
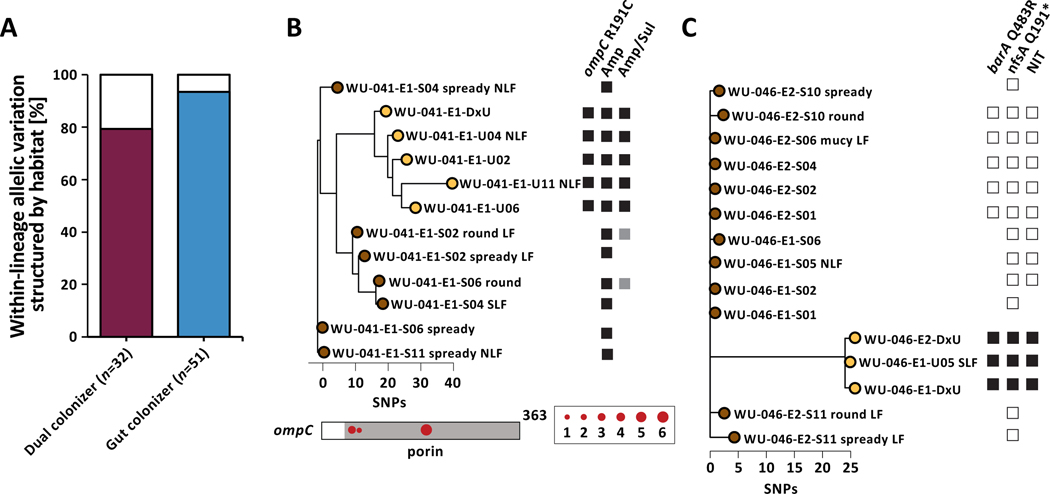
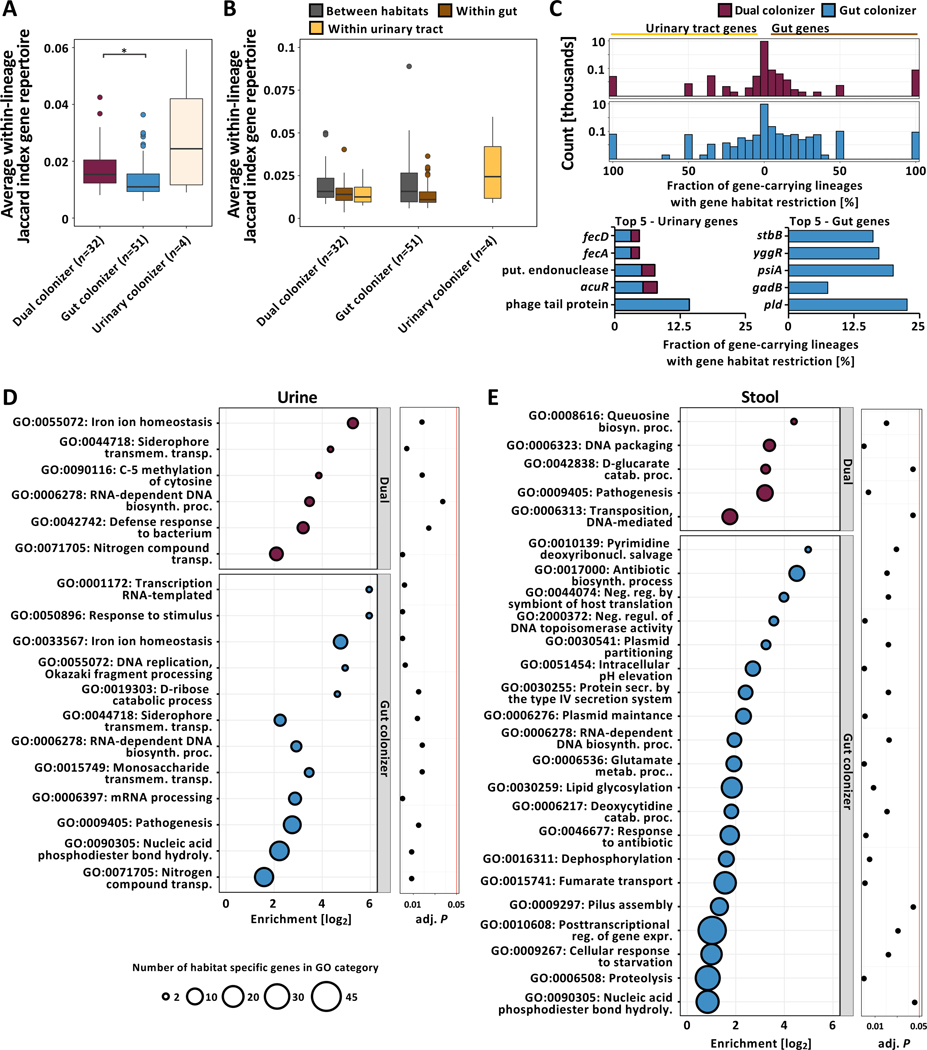
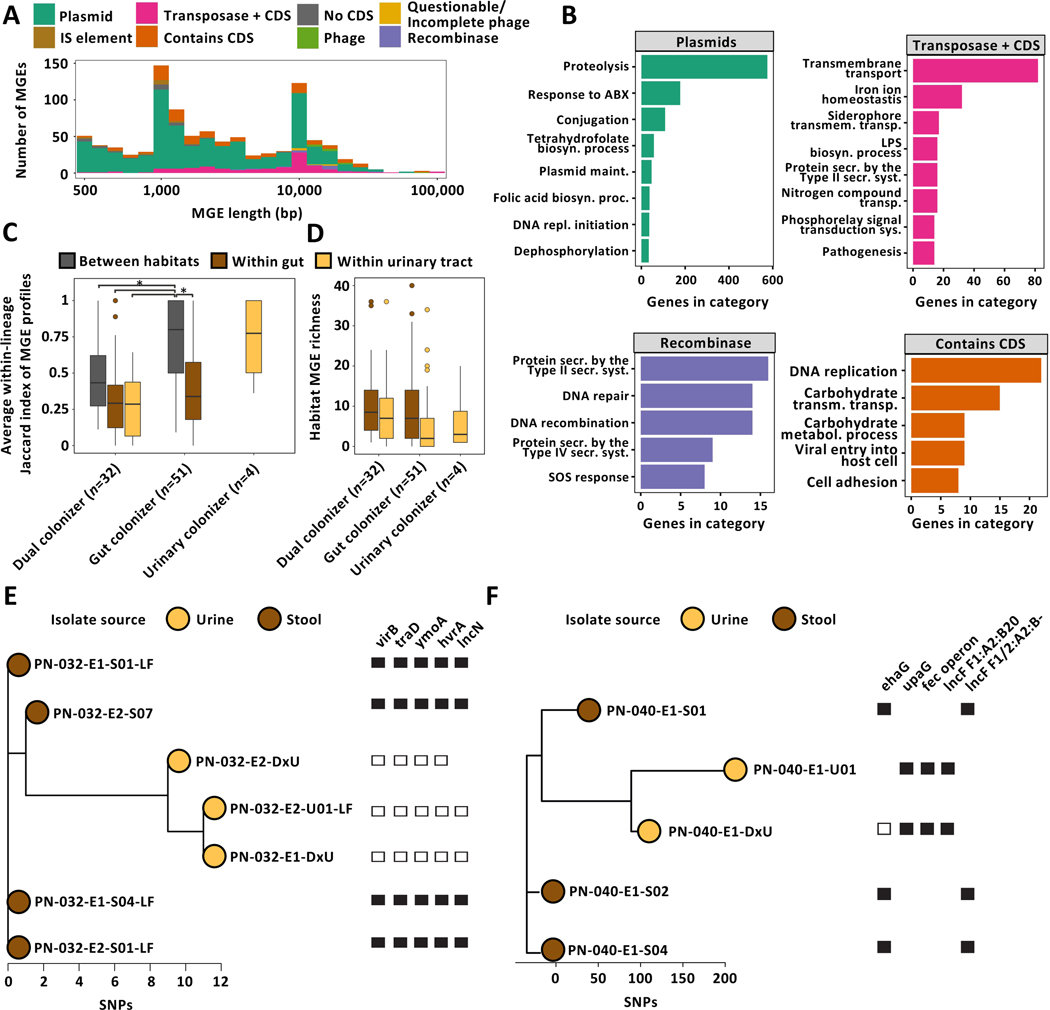
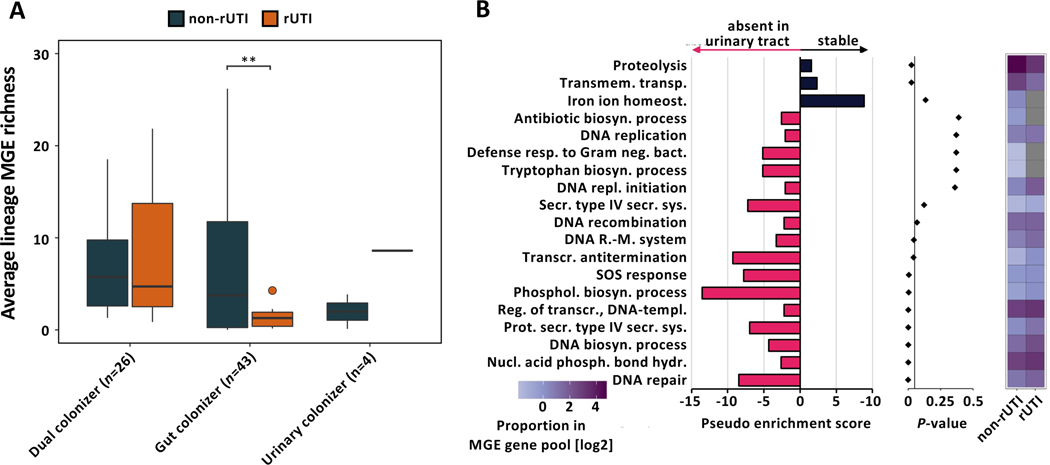
Large-scale genomic studies have identified within-host adaptation as a hallmark of bacterial infections. However, the impact of physiological, metabolic, and immunological differences between distinct niches on the pathoadaptation of opportunistic pathogens remains elusive. Here, we profile the within-host adaptation and evolutionary trajectories of 976 isolates representing 119 lineages of uropathogenic Escherichia coli (UPEC) sampled longitudinally from both the gastrointestinal and urinary tracts of 123 patients with urinary tract infections. We show that lineages persisting in both niches within a patient exhibit increased allelic diversity. Habitat-specific selection results in niche-specific adaptive mutations and genes, putatively mediating fitness in either environment. Within-lineage inter-habitat genomic plasticity mediated by mobile genetic elements (MGEs) provides the opportunistic pathogen with a mechanism to adapt to the physiological conditions of either habitat, and reduced MGE richness is associated with recurrence in gut-adapted UPEC lineages. Collectively, our results establish niche-specific adaptation as a driver of UPEC within-host evolution.

Keywords: evolution; genomic plasticity; mobile genetic elements; niche adaptation; pathoadaptation; uropathogenic Escherichia coli.


Conflict of interest statement

Declaration of interests The authors declare no competing interests.

Figures

Figure 1 |
Figure 1 |. Persistent UPEC lineages group into distinct colonization patterns.
(A) Schematic representation of UPEC colonization patterns (Left) as determined by recovery from stool (brown circles) and urine (yellow circles) from UTI patients with available DxU isolates. The definition for each colonization type is given below the schematic. UPEC lineages (n=119) are classified into four persistence types: gut colonizer, dual colonizer, urinary colonizer, and non colonizer. (Middle) UPEC lineage presence at follow-up sample collection points as determined by whole genome sequencing of isolates (Key: 1: enrollment; 2: 0–3 days post-antibiotic treatment (pAT); 3: 7–14 days pAT; 4: 30–60 days pAT; 5: 150–180 days pAT). Bars indicate the fraction of patient’s urine (yellow) and stool (brown) specimens positive for the disease causing UPEC lineage at each sampling point. Patients are grouped by UPEC lineage persistence type. Only data from the first episode caused by a UPEC lineage is shown. (Right) Number of UPEC lineages falling into each colonization category (gut colonizer=51, dual colonizer=32, urinary colonizer=4, and non colonizer=23). Boxes group together panels showing data of the same persistence type. (B) Sequence types (ST) are evenly distributed between UPEC persistence types. Prevalence of the two dominant STs, ST131 and ST1193, is color highlighted. (C) ST composition varies significantly between persisting and non-persisting lineages (n=110 lineages, Fisher’s exact test, P<0.001). ST131 (light purple) and ST1193 (dark purple) are significantly underrepresented in the set of non-persisting UPEC lineages (n=110 lineages, Fisher’s exact test, P<0.001). Prevalence of the two dominant STs, ST131 and ST1193, is color highlighted.
Figure 2 |
Figure 2 |. Niche-specific adaptation shapes UPEC within-host adaptation.
(A) Boxplot of lineage dMRCA values (n=87 lineages, Kruskal-Wallis P=1.38e−05, Dunn post-hoc test gut vs dual colonizer P=2.39e−05, gut vs urinary colonizer P=3.32e−02). Outliers (outside 1.5x interquartile range) are depicted as points. Whiskers represent 1.5x interquartile range. Upper, middle, and lower box lines indicate 75th, 50th, and 25th percentiles, respectively. (B) Histogram of gene-wise dN/dS values with signatures of non-random mutation (Permutation test, P<0.05) mutated in parallel across more than two lineages (m≥2, top) or in one lineage (m=1, middle), and in genes non-significant in permutation test (bottom). Median and median absolute deviation (MAD) are given for both gene groups. Dashed vertical line indicates neutral selection at dN/dS=1. (C) Genes found to be mutated in parallel in ≥3 lineages, normalized by the total number of gene-carrying lineages. Hypothetical genes are not shown. Color of the bar corresponds to colonization type in which mutations were found (gut colonizer - blue, dual colonizer - maroon, urinary colonizer - light yellow). Color bar below the histogram provides GO category (as shown in Fig 2D) for all genes with GO terms annotation found to be significantly enriched in a colonization type. (D) Network visualization of GO terms significantly overrepresented in the pool of genes with non-random signature of selection within-lineages as defined by the permutation test. Bubble size represents number of mutations in genes categorized into each GO term. Color of bubbles corresponds to colonization type GO terms were enriched in (gut colonizer: blue; dual colonizer: maroon; urinary colonizer: light yellow; gut/dual colonizer: purple; gut/urinary colonizer: black). GO terms were clustered semantically into the 2D space using REVIGO. Circles group together semantically related GO terms.
Figure 3 |
Figure 3 |. UPEC niche-specific adaptation impacts antibiotic resistance phenotypes.
(A) The majority of allelic diversity in genes found to be mutated in parallel within gut and dual colonizers is structured by habitat (Fisher’s exact test P=0.001). Color of the bar corresponds to either dual colonizer (maroon) or gut colonizers (blue). (B) (Top) Phylogeny of lineage WU-041_1 with annotated non-synonymous ompC mutation and corresponding phenotypic resistance to ampicillin/sulbactam. Black squares denote gene presence or antibiotic resistance. White squares indicate gene absence or drug susceptibility. Grey squares indicate intermediate drug susceptibility. Phylogeny is unrooted based on SNP distances. (Bottom) SNP locations on the ompC gene. The porin domain is annotated in grey. Circle size corresponds to number of isolates carrying that mutation. (C) Lineage WU-046_2 exhibited nonsynonymous barA and nfsA mutations in urinary isolates only, corresponding to phenotypic resistance to nitrofurantoin. Phylogeny is unrooted based on SNP distances. Labels as in (B).
Figure 4 |
Figure 4 |. Persisting UPEC lineages exhibit niche-specific genomic plasticity.
(A) Boxplot of average within-lineage Jaccard distances based on gene presence/absence data (n=87 lineages, Kruskal-Wallis test P=0.009, Dunn post-hoc test gut vs dual colonizer P=0.012). Outliers (outside 1.5x interquartile range) are depicted as points. Whiskers represent 1.5x interquartile range. Upper, middle, and lower box lines indicate 75th, 50th, and 25th percentiles, respectively. (B) Average between- and within-habitat lineage Jaccard distances based on gene presence/absence data of same-lineage isolates by colonization type (n=87 lineages, Two-way ANOVA, habitat P=5.94e−4, colonization type P>0.05). Outliers (outside 1.5x interquartile range) are depicted as points. Whiskers represent 1.5x interquartile range. Upper, middle, and lower box lines indicate 75th, 50th, and 25th percentiles, respectively. Colors correspond to within-lineage comparison (between habitats: grey; within gut: brown; within urinary tract: yellow). (C) (Top) Two-sided histogram of within-lineage habitat-specific genes of dual (maroon) and gut (blue) colonizers. Urinary-specific genes are shown towards the left. Gut-specific genes are shown towards the right. (Bottom) Genes most frequently found to be urine (left) or gut (right) specific across lineages, normalized by the total number of gene-carrying lineages. Bar color corresponds to the colonization type a gene was found in as habitat specific. Hypothetical genes are not shown. (D) Overrepresented GO terms associated with urine specific genes of dual (top - maroon) or gut colonizers (bottom - blue). Bubble size corresponds to the number of habitat-specific genes in each GO term. (E) Overrepresented GO terms associated with stool specific genes, using the same formatting as in (D).
Figure 5 |
Figure 5 |. Mobile genetic elements drive niche-specific genomic plasticity of UPEC.
(A) Visualization of within-lineage MGEs. Element length (log-scale) is plotted against element count. IS, insertion sequence; CDS, coding sequence. (B) GO terms overrepresented in selected MGE subclasses. (C) Box plot of average within-lineage Jaccard distance based on MGE presence/absence data of same-lineage isolates between habitats (grey), within gut (brown), and within urine (yellow) grouped by colonization type. All comparisons are statistically significant (n=87 lineages, Two-way ANOVA P≤1.57e−05, Tukey post-hoc gut colonizer within-gut vs between habitats P<0.001, gut colonizer between habitat vs dual colonizer between habitat P=0.014). (D) MGE richness is larger in gut compared to urine isolates (n=87 lineages, Two-way ANOVA P=0.042). Outliers (outside 1.5x interquartile range) are depicted as points. Whiskers represent 1.5x interquartile range. Upper, middle, and lower box lines indicate 75th, 50th, and 25th percentiles, respectively. (E) Unrooted phylogeny of lineage PN-040_1 based on SNP distances annotated with selected habitat-specific genes. Relative short-read coverage over selected, habitat-specific MGEs harboring depicted genes is shown. (F) Unrooted phylogeny of lineage PN-004_1 based on SNP distances annotated with selected habitat-specific genes. Relative short-read coverage over selected, habitat-specific MGEs harboring depicted genes is shown.
Figure 6 |
Figure 6 |. Gut colonizing UPEC lineages causing rUTI exhibit decreased MGE richness.
(A) MGE richness of lineages causing rUTI during the follow-up period and non-rUTI lineages parsed by colonization type (n=73 lineages, Welch’s t-test, FDR corrected gut colonizer P=0.001, dual and urinary colonizer FDR corrected P>0.05). Outliers (outside 1.5x interquartile range) are depicted as points. Whiskers represent 1.5x interquartile range. Upper, middle, and lower box lines indicate 75th, 50th, and 25th percentiles, respectively. (B) (Left) Pseudo enrichment score of GO terms in the pool of MGEs absent or stable in urinary isolates of gut colonizing UPEC lineages. Top 19 GO categories by P-value are visualized. Pink bars indicate gene associated GO terms overrepresented in the urine instable MGE pool, black bars indicate GO terms enriched in the pool of MGEs stable in urinary isolates. Pseudo enrichment score was calculated by adding one count to all GO categories. (Middle) P-values for each GO category determined from overrepresentation analysis using hypergeometric distribution. (Right) Proportion of each visualized GO term in the MGE associated gene pool of rUTI and non-rUTI causing lineages of gut colonizing UPEC. Grey tiles indicate absence of a GO term in the MGE gene pool.

Comment in

  • Fitting into your niche.
    Taglialegna A. Taglialegna A. Nat Rev Microbiol. 2022 Jul;20(7):382. doi: 10.1038/s41579-022-00748-3. Nat Rev Microbiol. 2022. PMID: 35610508 No abstract available.

References

    1. Antipov D, Hartwick N, Shen M, Raiko M, Lapidus A, and Pevzner PA. (2016). plasmidSPAdes: assembling plasmids from whole genome sequencing data. Bioinformatics 32, btw493. - PubMed
    1. Arndt D, Grant JR, Marcu A, Sajed T, Pon A, Liang Y, and Wishart DS. (2016). PHASTER: a better, faster version of the PHAST phage search tool. Nucleic Acids Res. 44, W16–W21. - PMC - PubMed
    1. Bankevich A, Nurk S, Antipov D, Gurevich AA, Dvorkin M, Kulikov AS, Lesin VM, Nikolenko SI, Pham S, Prjibelski AD, et al. (2012). SPAdes: A New Genome Assembly Algorithm and Its Applications to Single-Cell Sequencing. J. Comput. Biol. 19, 455–477. - PMC - PubMed
    1. Baym M, Kryazhimskiy S, Lieberman TD, Chung H, Desai MM, and Kishony R. (2015). Inexpensive Multiplexed Library Preparation for Megabase-Sized Genomes. PLoS One 10, e0128036. - PMC - PubMed
    1. Beloin C, Michaelis K, Lindner K, Landini P, Hacker J, Ghigo JM, and Dobrindt U. (2006). The Transcriptional Antiterminator RfaH Represses Biofilm Formation in Escherichia coli. J. Bacteriol. 188, 1316–1331. - PMC - PubMed

MeSH terms

Substances