Meta-Analysis
. 2022 Aug:102:105299.
doi: 10.1016/j.meegid.2022.105299. Epub 2022 May 8.

Human genetic factors associated with pneumonia risk, a cue for COVID-19 susceptibility

Affiliations
Meta-Analysis

Human genetic factors associated with pneumonia risk, a cue for COVID-19 susceptibility

Debleena Guin et al. Infect Genet Evol. 2022 Aug.

Abstract

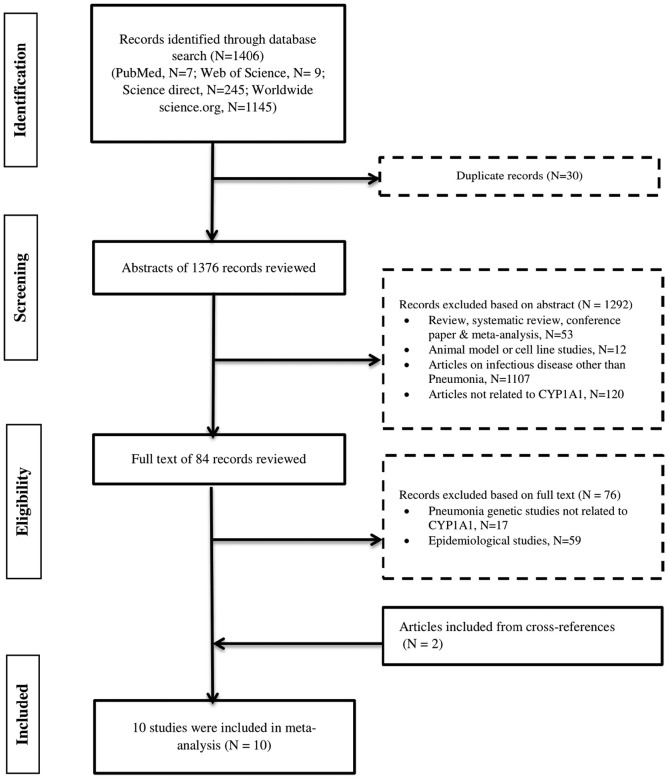
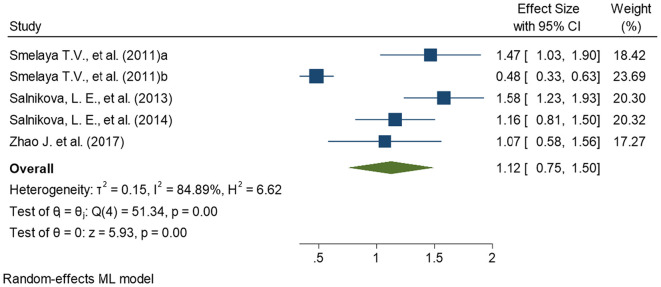
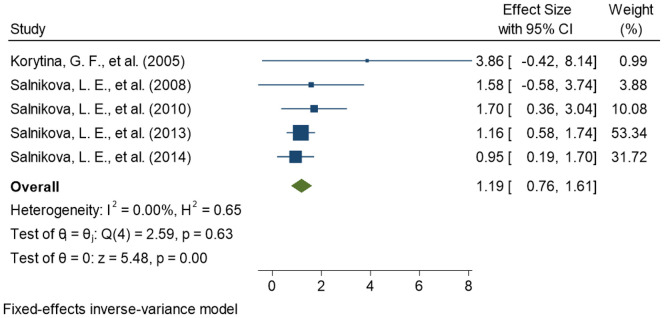
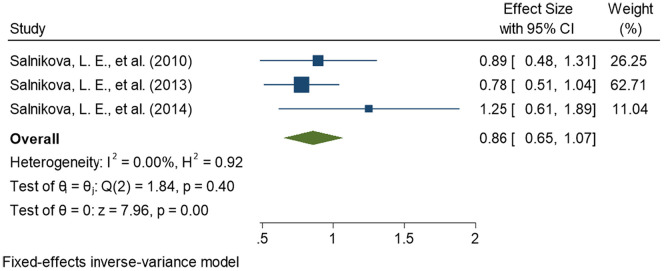
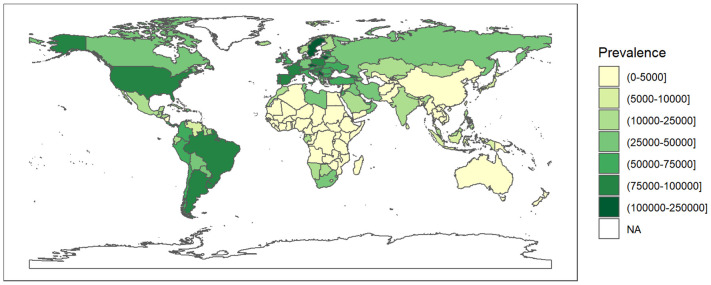
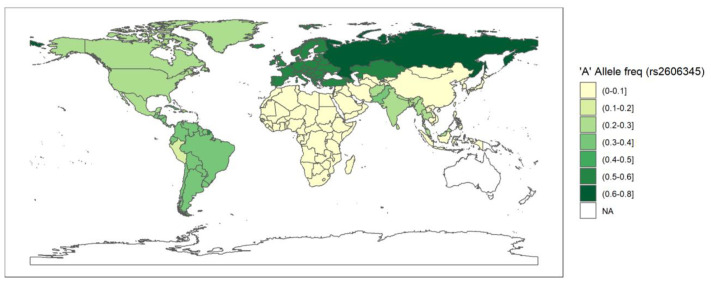
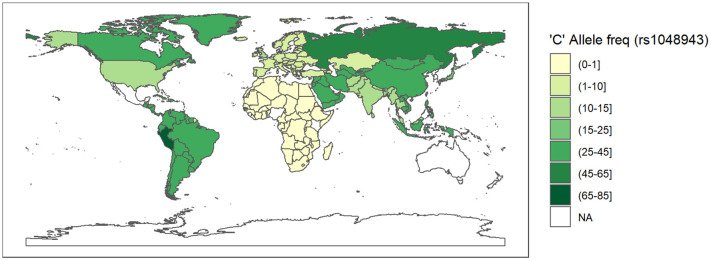
Pneumonia, an acute respiratory tract infection, is one of the major causes of mortality worldwide. Depending on the site of acquisition, pneumonia can be community acquired pneumonia (CAP) or nosocomial pneumonia (NP). The risk of pneumonia, is partially driven by host genetics. CYP1A1 is a widely studied pulmonary CYP family gene primarily expressed in peripheral airway epithelium. The CYP1A1 genetic variants, included in this study, alter the gene activity and are known to contribute in lung inflammation, which may cause pneumonia pathogenesis. In this study, we performed a meta-analysis to establish the possible contribution of CYP1A1 gene, and its three variants (rs2606345, rs1048943 and rs4646903) towards the genetic etiology of pneumonia risk. Using PRISMA guidelines, we systematically reviewed and meta-analysed case-control studies, evaluating risk of pneumonia in patients carrying the risk alleles of CYP1A1 variants. Heterogeneity across the studies was evaluated using I2 statistics. Based on heterogeneity, a random-effect (using maximum likelihood) or fixed-effect (using inverse variance) model was applied to estimate the effect size. Pooled odds ratio (OR) was calculated to estimate the overall effect of the risk allele association with pneumonia susceptibility. Egger's regression test and funnel plot were used to assess publication bias. Subgroup analysis was performed based on pneumonia type (CAP and NP), population, as well as age group. A total of ten articles were identified as eligible studies, which included 3049 cases and 2249 healthy controls. The meta-analysis findings revealed CYP1A1 variants, rs2606345 [T vs G; OR = 1.12 (0.75-1.50); p = 0.02; I2 = 84.89%], and rs1048943 [G vs T; OR = 1.19 (0.76-1.61); p = 0.02; I2 = 0.00%] as risk markers whereas rs4646903 showed no statistical significance for susceptibility to pneumonia. On subgroup analysis, both the genetic variants showed significant association with CAP but not with NP. We additionally performed a spatial analysis to identify the key factors possibly explaining the variability across countries in the prevalence of the coronavirus disease 2019 (COVID-19), a viral pneumonia. We observed a significant association between the risk allele of rs2606345 and rs1048943, with a higher COVID-19 prevalence worldwide, providing us important links in understanding the variability in COVID-19 prevalence.

Keywords: COVID-19; CYP1A1; Community acquired pneumonia; Genetic variants; Meta-analysis; Nosocomial pneumonia; Pneumonia.


Conflict of interest statement

The authors declare that the research was conducted in the absence of any commercial or financial relationships that could be construed as a potential conflict of interest.

Figures

Fig. 1
Fig. 1
Flow chart of study selection in metaanalysis of CYP1A1 polymorphisms with Pneumonia risk. Study methodology for the inclusion and exclusion of studies exploring the role of CYP1A1 genetic variants in pneumonia patients. The number of studies excluded on each step is represented as N.
Fig. 2
Fig. 2
Forest plot determining association of CYP1A1 variant, rs2606345, with pneumonia. The square and horizontal lines correspond to the study- specific odds ratio(OR) and 95% confidence interval (CI). The area of the square refers to the study specific weight (random model; maximum likelihood).The diamond represents the summary of OR and 95% CI. Smelaya et al., 2011 includes CAP patients; Smelaya et al. (2011) includes NP patients.
Fig. 3
Fig. 3
Forest plot determining association of CYP1A1 variant, rs1048943, with pneumonia. The square and horizontal lines correspond to the study- specific odds ratio(OR) and 95% confidence interval (CI). The area of the square refers to the study specific weight (Fixed effect; inverse of variance).The diamond represents the summary of OR and 95% CI.
Fig. 4
Fig. 4
Forest plot determining association of CYP1A1 variant, rs4646903, with pneumonia. The square and horizontal lines correspond to the study- specific odds ratio(OR) and 95% confidence interval (CI). The area of the square refers to the study specific weight (fixed effect; inverse of variance).The diamond represents the summary of OR and 95% CI.
Fig. 5
Fig. 5
A geospatial distribution map of prevalence (the number of cases per million) as on 24 May 2021 worldwide due to COVID-19. COVID-19 prevalence is extracted from ourworldindata.org till 24 May 2021. The white colored areas in the map show the absence of data. A half open intervals includes only one of its end-points and is denoted by mixing notations for open and closed intervals. For e.g., (0–1] means greater than 0 and less than or equal to 1 and [0, 1) means greater than or equal to 0 and less than 1.
Fig. 6
Fig. 6
A geospatial frequency maps depicting the distribution of risk allele ‘A' frequency of rs2606345 (CYP1A1).
Fig. 7
Fig. 7
A geospatial frequency maps depicting the distribution of risk allele ‘C' frequency of rs1048943 (CYP1A1). The data is obtained from population frequency data of the 1000genome browser on 8 March 2021. The white coloured areas in the map show the absence of data. A half open intervals includes only one of its end-points and is denoted by mixing notations for open and closed intervals. For e.g., (0–1] means greater than 0 and less than or equal to 1 and [0,1) means greater than or equal to 0 and less than 1.

Similar articles

Cited by

References

    1. Begg C.B., Mazumdar M. Operating characteristics of a rank correlation test for publication bias. Biometrics. 1994;50:1088–1101. - PubMed
    1. Berlin D.A., Gulick R.M., Martinez F.J. Severe Covid-19. N. Engl. J. Med. 2020;383:2451–2460. doi: 10.1056/NEJMcp2009575. - DOI - PubMed
    1. Bui P., Imaizumi S., Beedanagari S.R., Reddy S.T., Hankinson O. Human CYP2S1 metabolizes cyclooxygenase- and lipoxygenase derived eicosanoids. Drug Metab. Dispos. 2011;39(2):180–190. doi: 10.1124/dmd.110.035121. - DOI - PMC - PubMed
    1. Cochran W.G. The combination of estimates from different experiments. Biometrics. 1954;10:101–129. doi: 10.2307/3001666. - DOI
    1. Consortium, T. G. P A global reference for human genetic variation. Nature. 2015;526:68–74. doi: 10.1038/nature15393. - DOI - PMC - PubMed

Publication types

Substances