. 2022 Jun 15;42(24):4841-4851.
doi: 10.1523/JNEUROSCI.2290-20.2022. Epub 2022 May 11.

Existence of a Long-Range Caudo-Rostral Sensory Influence in Terrestrial Locomotion

Affiliations

Existence of a Long-Range Caudo-Rostral Sensory Influence in Terrestrial Locomotion

Martyna Grabowska et al. J Neurosci. .

Abstract

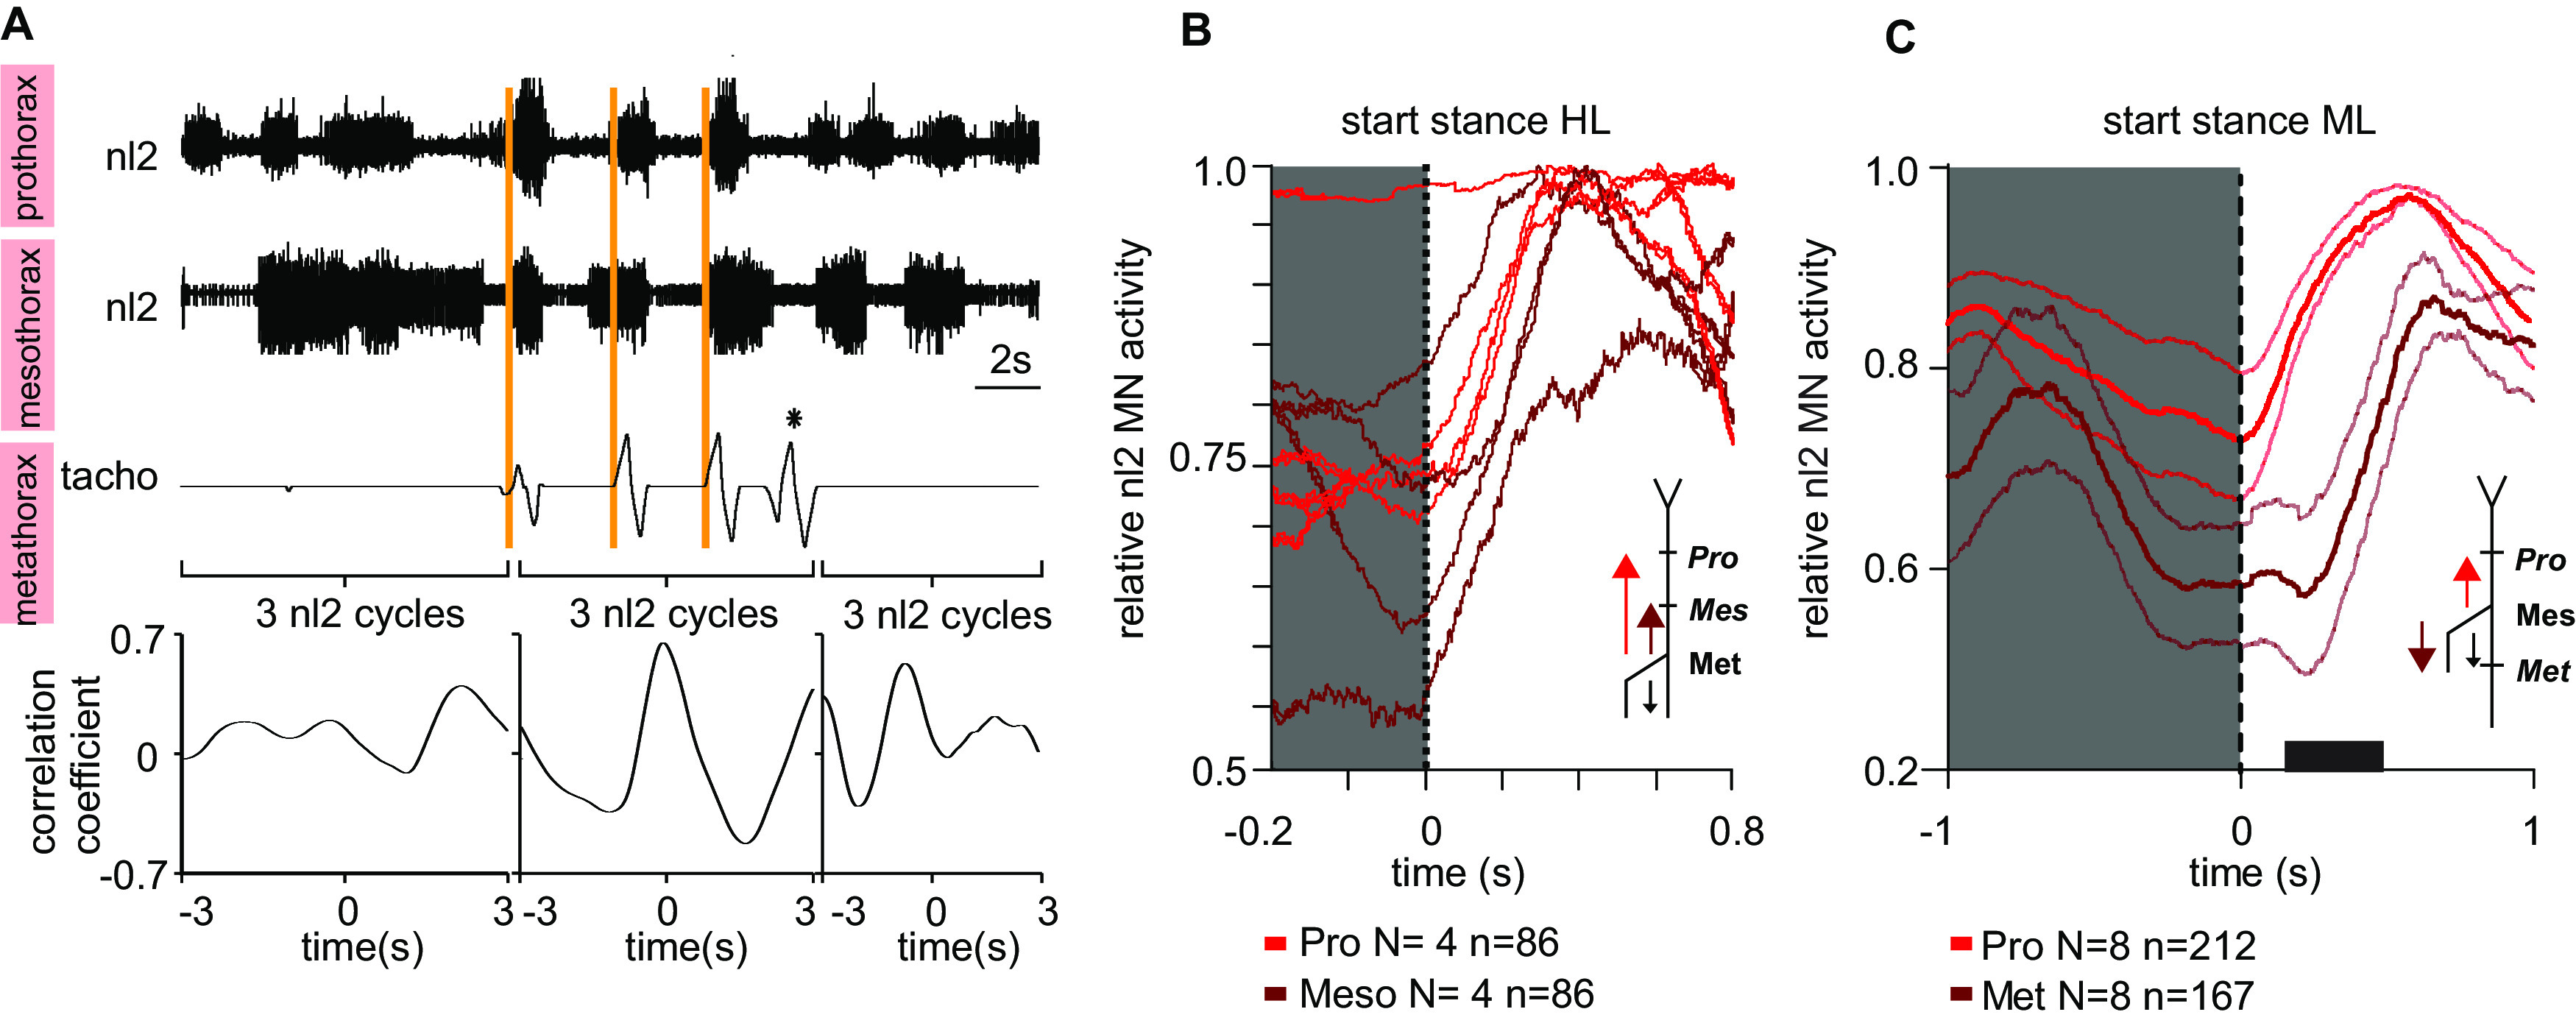
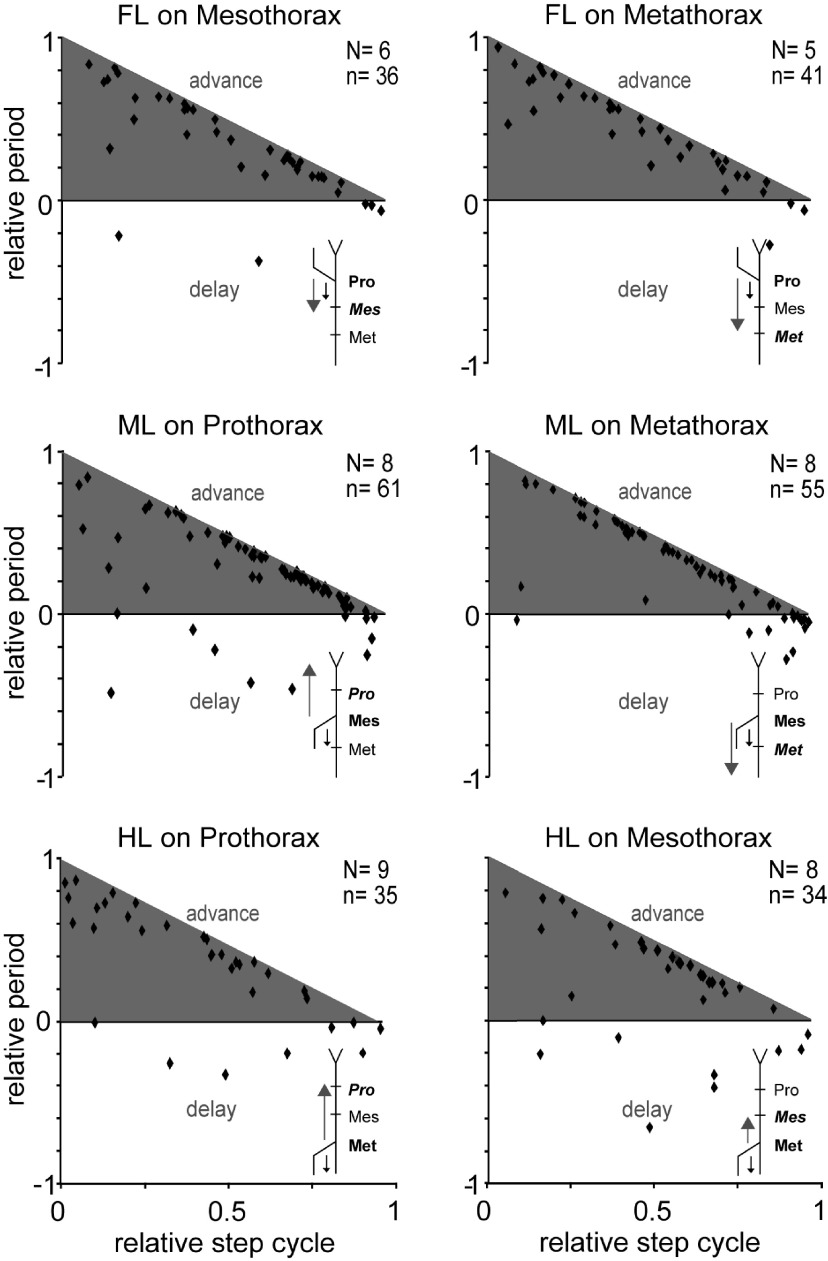
In multisegmented locomotion, coordination of all appendages is crucial for the generation of a proper motor output. In running for example, leg coordination is mainly based on the central interaction of rhythm generating networks, called central pattern generators (CPGs). In slower forms of locomotion, however, sensory feedback, which originates from sensory organs that detect changes in position, velocity and load of the legs' segments, has been shown to play a more crucial role. How exactly sensory feedback influences the activity of the CPGs to establish functional neuronal connectivity is not yet fully understood. Using the female stick insect Carausius morosus, we show for the first time that a long-range caudo-rostral sensory connection exists and highlight that load as sensory signal is sufficient to entrain rhythmic motoneuron (MN) activity in the most rostral segment. So far, mainly rostro-caudal influencing pathways have been investigated where the strength of activation, expressed by the MN activity in the thoracic ganglia, decreases with the distance from the stepping leg to these ganglia. Here, we activated CPGs, producing rhythmic neuronal activity in the thoracic ganglia by using the muscarinic agonist pilocarpine and enforced the stepping of a single, remaining leg. This enabled us to study sensory influences on the CPGs' oscillatory activity. Using this approach, we show that, in contrast to the distance-dependent activation of the protractor-retractor CPGs in different thoracic ganglia, there is no such dependence for the entrainment of the rhythmic activity of active protractor-retractor CPG networks by individual stepping legs.SIGNIFICANCE STATEMENT We show for the first time that sensory information is transferred not only to the immediate adjacent segmental ganglia but also to those farther away, indicating the existence of a long-range caudo-rostral sensory influence. This influence is dependent on stepping direction but independent of whether the leg is actively or passively moved. We suggest that the sensory information comes from unspecific load signals sensed by cuticle mechanoreceptors (campaniform sensilla) of a leg. Our results provide a neuronal basis for the long-established behavioral rules of insect leg coordination. We thus provide a breakthrough in understanding the neuronal networks underlying multilegged locomotion and open new vistas into the neuronal functional connectivity of multisegmented locomotion systems across the animal kingdom.

Keywords: CPG; entrainment; inter-segmental coordination; locomotion; six-legged walking.


Figures

Figure 1.
Figure 1.
Example for data point extraction and analysis. The two upper traces show extracellularly recorded activity of the retractor (nl5) and protractor (nl2) MNs of the prothoracic ganglion under the influence of pilocarpine. The two lower traces display the treadmill movements (tacho), and the activity (EMG) of the flexor muscle of the ipsilateral hind leg. The periods of the cyclic activity of the protractor MNs Tp1, Tp2, and Tp3 (of which only Tp2 and Tp3 are shown; black, two-headed arrows) are averaged to obtain the mean period Tp (not shown in the figure). These cycles immediately precede the next stance phase whose start is marked by an orange vertical line. Hence, d (orange, two-headed arrow) is the time from the start of the last protractor MN burst to the start of this stance phase. Finally, T (red, two-headed arrow) denotes the time from the start of the last protractor MN burst before this stance phase to the start of the next protractor MN burst (red vertical line). The schematic of a stick insect on the right-hand side illustrates the experimental arrangement: the hind leg of the metathoracic segment (bold) performs a forward stance phase (black arrow), and the effect of this action on the activity of the protractor and retractor MNs of the prothoracic ganglion (bold italic) is analyzed (gray arrow).
Figure 2.
Figure 2.
Enforced forward stepping of the ipsilateral hind leg entrains pilocarpine-induced rhythmic activity of the prothoracic protractor and retractor CPG. A, Extracellular recordings from protractor MNs (nl2) and retractor MNs (nl5) in the prothoracic ganglion, as indicated; tachometer signal of the treadmill. A positive amplitude in the tacho trace represents a stance phase during a forward step. Protractor MN activity is coupled to the stance phase of enforced forward steps of the hind leg (orange lines). B, Phase histogram showing the relative spike counts in the protractor (red) and retractor (blue) MN discharges within an enforced forward step cycle in one animal. C, Relative proportion of the transitions between MN activities at the start of an enforced hind leg stance phase for forward stepping. p+r– = start of protractor activity and end of retractor activity. p–r+ = end of protractor activity and start of retractor activity. p+r+ = co-activation of both MN pools. p–r– = no MN activity observed after the start of a hind leg stance phase (N = 11). Pairwise comparisons were performed with the Wilcoxon rank-sum test and multiple comparisons using the Kruskal–Wallis test with a Dunn's correction for multiple comparisons, ***p < 0.001, error bars = SEMs. D, Prothoracic protractor and retractor MN burst activity during enforced forward stance phases of the hind leg (N = 11). Circular plot shows mean vectors of nl2 (red) and nl5 (blue) MN activity within a step cycle (Rayleigh test for circular data, p < 0.001). N = number of animals, n = number of steps.
Figure 3.
Figure 3.
Ipsilateral hind leg stepping entrains the pilocarpine-induced rhythmic activity of the prothoracic and mesothoracic protractor and retractor CPGs. A, Upper panel, Extracellular recordings from protractor MNs in the prothoracic and mesothoracic ganglion, as indicated; tachometer signal of the treadmill. Orange vertical lines mark the start of the enforced stance phases. The peak in the tacho trace, marked by a star, led to no protractor MN activation since this stance phase might have occurred too soon within the step cycle of the prothoracic and mesothoracic protractor MNs rhythm. Bottom panel, Cross-correlation function between the two neuronal activities computed before, during and after the induction of the stance phases for a period of 6 s each (Pearson's correlation test). B, Waveform average of prothoracic and mesothoracic protractor MN burst activity after enforced stance phases (n = 86, N = 4). The diagram shows the reaction time of the prothoracic (light red) and mesothoracic (dark red) protractor MNs after an enforced forward stance phase of the hind leg (t = 0). The schematic of a stick insect indicates the experimental setup. The large light red and dark red arrows show the direction of influence of the stepping hind leg to be investigated, the small black arrow the direction of the leg movement during the enforced stance phase. C, Forward walking of the middle leg results in a faster nl2 activity onset in the prothoracic ganglion than in the metathoracic ganglion. Waveform average of relative nl2 MN activity of prothoracic (light red) and metathoracic (dark red) protractor MN burst activity after stance phase enforcements [n = 167 (metathorax); n = 212 (prothorax), N = 8]. Significance in onset difference is shown as black bar on the x-axis with p < 0.05. Faded lines display SEMs. Differences in the curves were calculated using multiple paired t tests per time point and correcting for false discovery rate (FDR) using the two-stage step-up method previously described (Benjamini et al., 2006) with a FDR = 1%. The schematic of a stick insect indicates the experimental setup. The large dark red and light red arrows show the direction of influence of the stepping hind leg to be investigated, the small black arrow the direction of the leg movement during the enforced stance phase. N = number of animals, n = number of steps.
Figure 4.
Figure 4.
Relation between enforced forward leg movements and protractor MN burst activity in the other two deafferented thoracic ganglia activated by pilocarpine. The panels show PRCs. Upper panels, Front leg (FL) forward stance phases triggered entrainment of the rhythmic activity of the MNs of the two other segments: correlation coefficient c = −0.99 and p < 0.001 for the mesothoracic, and c = −0.69 and p < 0.001 for the metathoracic ganglion. Middle panels, Middle leg (ML) stance phases triggered entrainment of the rhythmic MN activity in the adjacent ganglia with c = −0.61 and p < 0.001 in the prothoracic, and c = −0.8347 and p < 0.001 in the metathoracic ganglion. Bottom panels, Hind leg (HL) stance phases triggered entrainment of the rhythmic activity of the prothoracic and mesothoracic protractor MNs with c = −0.76 and p < 0.001 and c = −0.46 and p < 0.05 (0.037), respectively. The schematic of a stick insect below each individual panel indicates the experimental arrangement in each condition. Segment names written in bold denote the segment of the leg movement, whereas segment names in bold italic the segments under the influence of pilocarpine. The large gray arrow shows the direction of influence of the stepping leg to be investigated, while the small black arrow shows the direction of the stance phase (forward steps for all situations shown).
Figure 5.
Figure 5.
An enforced backwards stance phase results in the entrainment of the pilocarpine-induced rhythmic activity of the prothoracic protractor and retractor CPG. A, Extracellular recordings from protractor MNs (nl2) and retractor MNs (nl5) in the prothoracic ganglion, as indicated; tachometer signal of the treadmill. A negative amplitude in the tacho trace represents a stance phase during a backward step. The onsets of the backward stance phases (orange vertical lines) are immediately followed by prothoracic retractor activity and protractor quiescence. B, Phase histogram showing the relative spike counts in the protractor (red) and retractor (blue) MN discharges within an enforced backward step cycle. This phase histogram was obtained over 20 steps in one animal. C, Proportions of transitions during a step cycle of an enforced backwards moved hind leg (abbreviations are the same as in Fig. 2C). Pairwise comparisons were performed with the Wilcoxon rank-sum test and multiple comparisons using the Kruskal–Wallis test with a Dunn's correction for multiple comparisons; **p < 0.01, ***p < 0.001, error bars = SEMs. D, Mean vectors of the prothoracic protractor and retractor MN spike distribution during enforced backward stepping (N = 11). All except two mean vectors of the prothoracic protractor and retractor MN activity show significant directionality (Rayleigh test for circular data, p < 0.001). N = number of animals, n = number of steps.
Figure 6.
Figure 6.
Active stepping of the hind leg in both directions has the same influence on the pilocarpine-induced prothoracic protractor-retractor CPG activity than enforced stepping. A, Retractor MN activity is coupled to the stance phase of self-generated backward steps of the hind leg. Extracellular recordings from protractor MNs (nl2) and retractor MNs (nl5) in the prothoracic ganglion, as indicated; tachometer signal of the treadmill. A negative amplitude in the tacho trace represents a stance phase during a backward step. The beginning of a stance phase is marked by a solid orange vertical line. Bottom trace shows flexor EMG activity of the stepping hind leg. B, Relative MN spike count for nl2 MNs (red) and nl5 MNs (blue) for one animal in a walking sequence of n = 12 steps. C, Proportions of transitions for all recorded step cycles (N = 9, n = 92). Notations are the same as in Figure 2C. Pairwise comparisons were performed with the Wilcoxon rank-sum test and multiple comparisons using the Kruskal–Wallis test with a Dunn's correction for multiple comparisons; **p < 0.01, ***p < 0.001, error bars = SEMs. D, Mean vectors of the prothoracic protractor and retractor MN spike distribution during active backward stepping, N = 9. All mean vectors (N = 8) of the prothoracic protractor and retractor MN activity except for one “protractor” (N = 1) vector show significant directionality (p < 0.001, Rayleigh test for circular data). E, Extracellular protractor MN activity is coupled to the stance phase of self-generated forward steps of the hind leg. Orange vertical lines: start of stance phases. EMG activity shows flexor muscle activity of the hind leg. The positive amplitude of the tacho trace shows the stance phase of the hind leg. F, Distribution of the protractor (red) and retractor (blue) MN activity, represented by the relative MN spike count (N = 1, 9 steps). G, Relative proportion of the transitions between MN activities at the start of an active hind leg stance phase during forward stepping. Notations are the same as in C. Pairwise comparisons were performed with the Wilcoxon rank-sum test and multiple comparisons using the Kruskal–Wallis test with a Dunn's correction for multiple comparisons; ***p < 0.001, error bars = SEMs. H, Mean vectors of the prothoracic protractor (red) and retractor (blue) MN spike distribution during a forward step cycle of the hind leg (N = 3). All but one vector show significant directionality at a significance level of p < 0.01 (Rayleigh test for circular data). Upper and Lower panels, The small black arrow in the schematic of a stick insect displays the direction of the leg movement during the stance phase. The gray arrow indicates the direction of the sensory influence that is investigated. N = number of animals, n = number of steps.
Figure 7.
Figure 7.
Pilocarpine-induced rhythm in the prothoracic protractor-retractor CPG was entrained by stimulation of campaniform sensilla. A, Upper panel, Scheme of preparation and experimental procedure. The leg was fixated at the coxa-trochanter joint (black) to prevent active movement (see Materials and Methods). The leg stump was then bent (green arrow) in a backward direction mimicking loading signals during a forward step. Lower traces, The flexor muscle of the remaining hind leg stump was activated during bending (green lines). A bending in backward direction resulted in prothoracic protractor (nl2) MN activity (red lines). B, PRC shows that all protractor MN bursts occurred directly after the stimulation (bending). N = 3, n = 14. N = number of animals, n = number of stimulations.

Similar articles

Cited by

References

    1. Akay T, Bässler U, Gerharz P, Büschges A (2001) The role of sensory signals from the insect coxa-trochanteral joint in controlling motor activity of the femur-tibia joint. J Neurophysiol 85:594–604. 10.1152/jn.2001.85.2.594 - DOI - PubMed
    1. Akay T, Haehn S, Schmitz J, Büschges A (2004) Signals from load sensors underlie interjoint coordination during stepping movements of the stick insect leg. J Neurophysiol 92:42–51. 10.1152/jn.01271.2003 - DOI - PubMed
    1. Bässler U (1977) Sense organs in the femur of the stick insect and their relevance to the control of position of the femur-tibia-joint. J Comp Physiol 121:99–113.
    1. Bässler U, Büschges A (1998) Pattern generation for stick insect walking movements—multisensory control of a locomotor program. Brain Res Brain Res Rev 27:65–88. 10.1016/s0165-0173(98)00006-x - DOI - PubMed
    1. Batschelet E (1981) Circular statistics in biology. San Diego: Academic Press.

Publication types

LinkOut - more resources