. 2022 Jun;32(6):1137-1151.
doi: 10.1101/gr.276362.121. Epub 2022 May 11.

Automated annotation of human centromeres with HORmon

Affiliations

Automated annotation of human centromeres with HORmon

Olga Kunyavskaya et al. Genome Res. 2022 Jun.

Abstract

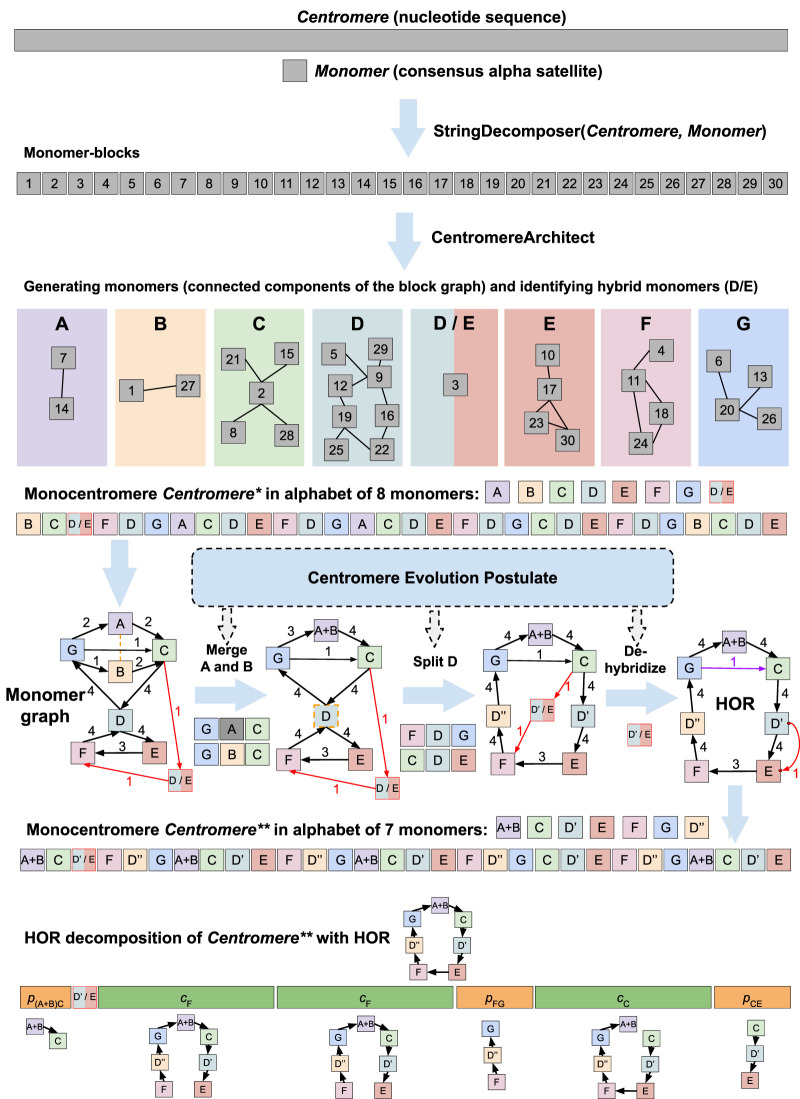
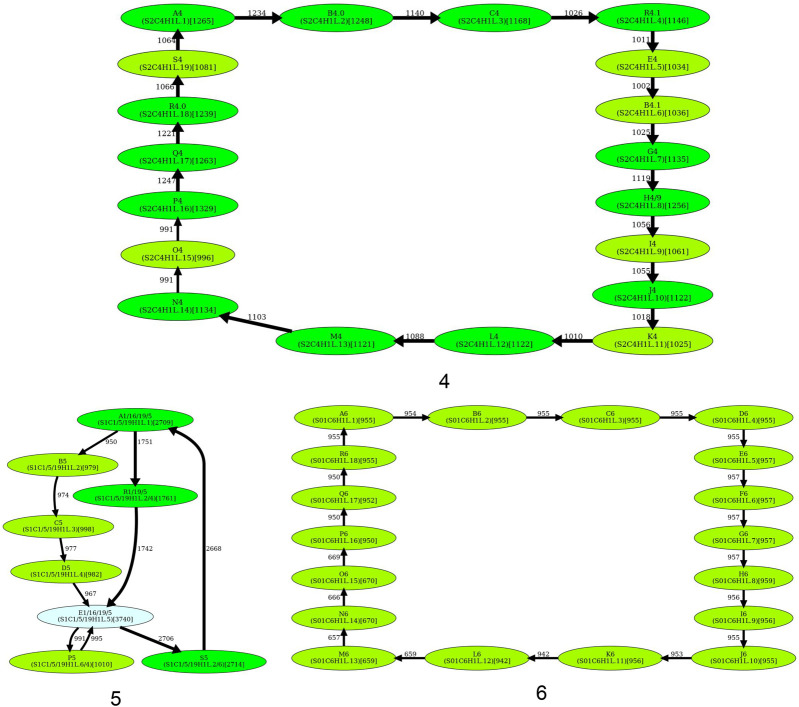
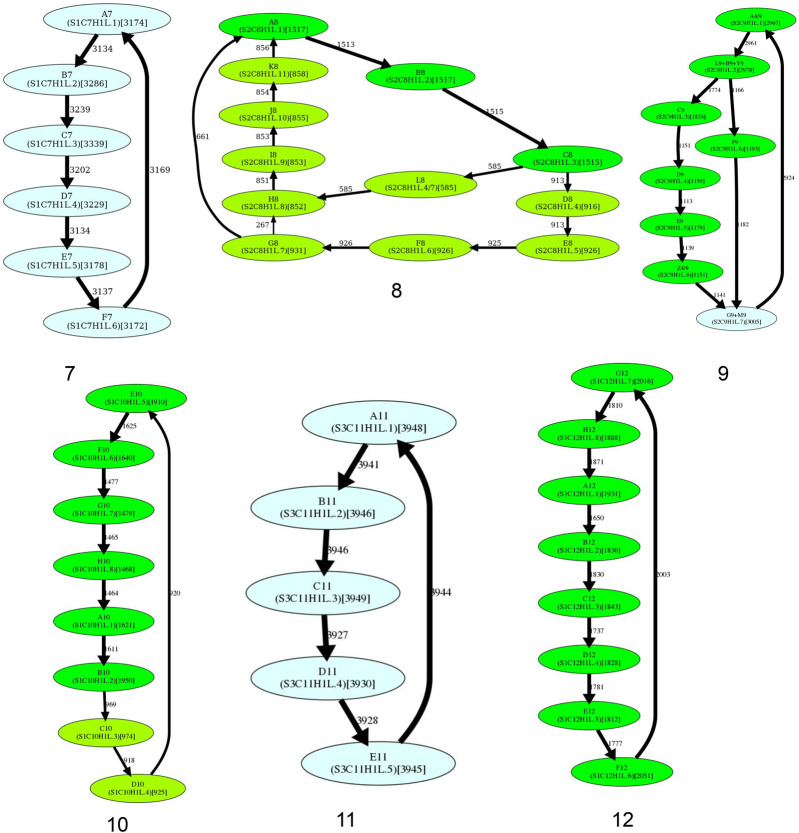
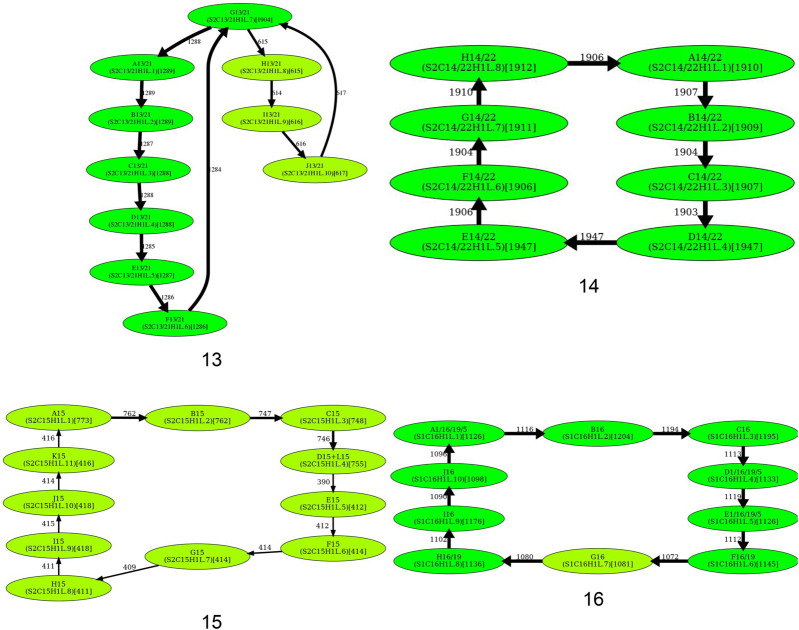
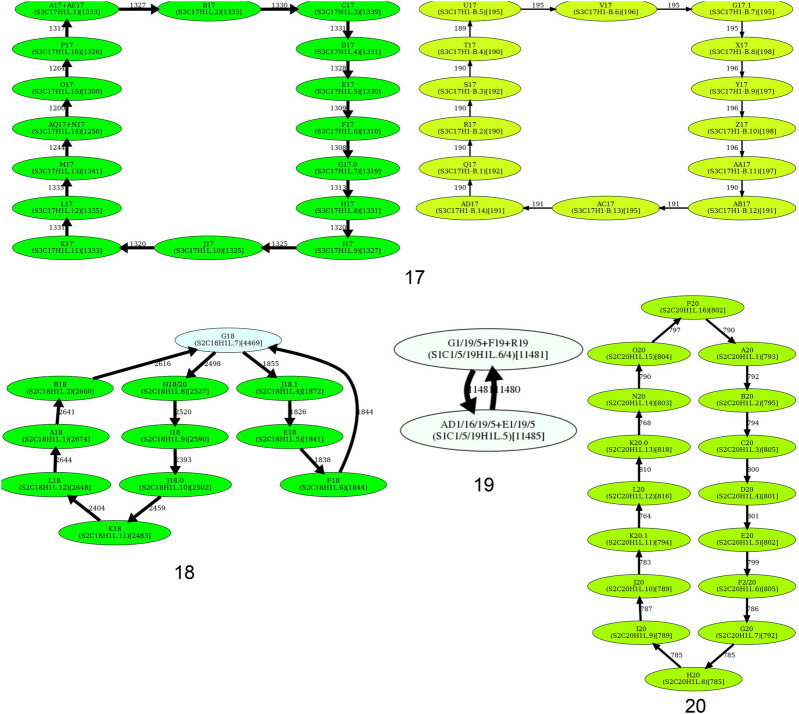
Recent advances in long-read sequencing opened a possibility to address the long-standing questions about the architecture and evolution of human centromeres. They also emphasized the need for centromere annotation (partitioning human centromeres into monomers and higher-order repeats [HORs]). Although there was a half-century-long series of semi-manual studies of centromere architecture, a rigorous centromere annotation algorithm is still lacking. Moreover, an automated centromere annotation is a prerequisite for studies of genetic diseases associated with centromeres and evolutionary studies of centromeres across multiple species. Although the monomer decomposition (transforming a centromere into a monocentromere written in the monomer alphabet) and the HOR decomposition (representing a monocentromere in the alphabet of HORs) are currently viewed as two separate problems, we show that they should be integrated into a single framework in such a way that HOR (monomer) inference affects monomer (HOR) inference. We thus developed the HORmon algorithm that integrates the monomer/HOR inference and automatically generates the human monomers/HORs that are largely consistent with the previous semi-manual inference.


Figures

Figure 1.
Figure 1.
The architecture of centromere on Chromosome X. The centromere of Chromosome X (cenX) consists of ∼18,100 monomers of length ≅171 bp each based on the cenX assembly in Bzikadze and Pevzner (2020); the T2T assembly (Nurk et al. 2022) represents a minor change to this assembly. These monomers are organized into ∼1500 units. Five units are colored by five shades of green illustrating unit variations. Each unit is a stacked tandem repeat formed by various monomers. The vast majority of units in cenX correspond to the canonical HOR, which is formed by 12 monomers (shown by 12 different colors). The figure on top represents the dot plot of the nucleotide sequence of the canonical HOR that reveals 12 monomers. Although the canonical units are 95%–100% similar, monomers are only 65%–88% similar. In addition to the canonical 12-monomer units, cenX has a small number of partial and auxiliary HORs with varying numbers of monomers.
Figure 2.
Figure 2.
HORmon pipeline. Given the nucleotide sequence Centromere and a consensus alpha satellite sequence Monomer, HORmon iteratively launches StringDecomposer (Dvorkina et al. 2020) to partition Centromere into monomer blocks. After each launch of StringDecomposer, HORmon launches CentromereArchitect (Dvorkina et al. 2021) to cluster similar monomer blocks into monomers, identify hybrid monomers (represented by a single hybrid D/E of monomers D and E), and transform Centromere into the monocentromere Centromere*. Afterward, HORmon uses the generated monocentromere to construct a monomer graph (red edges connect the hybrid monomer D/E with the rest of the monomer graph). To comply with the centromere evolution postulate, HORmon performs split/merge transformations and dehybridizations on the initial monomer set. The orange dotted undirected edge connects similar monomers A and B to indicate that they represent candidates for merging. The breakable monomer D is shown as a dotted vertex to indicate that it is a candidate for splitting into monomers D′ and D′′. The dehybridization substitutes the hybrid vertex D′/E by a single red edge that connects the prefix of D′ with the suffix of E. Split, merge, and dehybridization operations result in a new monomer set and transform Centromere into the monocentromere Centromere**. The black cycle in the monomer graph of Centromere* represents the HOR; the purple edge connecting monomers G and C is a low-frequency chord in this cycle. HORmon uses this HOR to generate the HOR decomposition of Centromere** into the canonical (cF, cC), partial (p(A + B)C, pFG, pCE), and auxiliary (the single block D′/E) HORs. cF and cC refer to traversing the (canonical) HOR starting from monomers F and C, respectively. p(A + B)C, pFG, and pCE refer to partial traversals of the HOR from monomer A + B to C, from F to G, and from C to E, respectively.
Figure 3.
Figure 3.
The monomer graph of cenX in the CHM13 (top) and HG002 (bottom) genomes. The monomer graphs of cenX were constructed on the monocentromere that was generated from the monomer sets consisting of two infrequent hybrid monomers (labeled as MX and NX) and 12 frequent canonical monomers (labeled as AX, BX, CX, …, KX, and LX) that contribute to the canonical DXZ1 HOR in cenX (Dvorkina et al. 2021). Small font corresponds to the naming conventions introduced in Shepelev et al. (2015). The hybrid monomers M and N are inferred in Dvorkina et al. (2020). A hybrid monomer formed by frequent monomers X and Y is represented as a bicolored vertex (two colors correspond to the colors of X and Y) and is denoted as (X/Y). Only edges of the monomer graph with multiplicity exceeding 1 are shown (edges with multiplicity exceeding 100 are shown in bold). The cycle formed by bold edges (with multiplicities above 1500) traverses the 12 most frequent monomers that form the canonical cenX HOR.
Figure 4.
Figure 4.
The simplified monomer graphs of human centromeres. The first 23 subfigures contain simplified monomer graphs for all live human centromeres in the CHM13 cell line (centromere ID shown in the subcaption). The 24th subfigure corresponds to the centromere on Chromosome Y in the HG002 genome. In each graph, vertices represent the monomer set Monomers of the corresponding Centromere. The label of each vertex represents the monomer ID and its count in the monocentromere Centromere* (in parentheses). The ID of the monomers follow the naming convention introduced in Shepelev et al. (2015). Two monomers are connected by an edge if they are consecutive in monocentromere Centromere*. The weight of an edge connecting monomers M and M′ is defined as the number of times M is followed by M′ in Centromere*. The width of an edge (color of a vertex) reflects its multiplicity (count of a monomer). In each graph, HORmon detects heavy nonoverlapping cycles and paths and removes chords in such cycles (for details, see Methods). The isolated cycles in 18 centromeres (2, 3, 4, 6, 7, 10, 11, 12, 14, 15, 16, 17, 19, 20, 21, 22, X, and Y) represent HORs in these centromeres. (Figure continues on following pages.)
Figure 4.
Figure 4.
The simplified monomer graphs of human centromeres. The first 23 subfigures contain simplified monomer graphs for all live human centromeres in the CHM13 cell line (centromere ID shown in the subcaption). The 24th subfigure corresponds to the centromere on Chromosome Y in the HG002 genome. In each graph, vertices represent the monomer set Monomers of the corresponding Centromere. The label of each vertex represents the monomer ID and its count in the monocentromere Centromere* (in parentheses). The ID of the monomers follow the naming convention introduced in Shepelev et al. (2015). Two monomers are connected by an edge if they are consecutive in monocentromere Centromere*. The weight of an edge connecting monomers M and M′ is defined as the number of times M is followed by M′ in Centromere*. The width of an edge (color of a vertex) reflects its multiplicity (count of a monomer). In each graph, HORmon detects heavy nonoverlapping cycles and paths and removes chords in such cycles (for details, see Methods). The isolated cycles in 18 centromeres (2, 3, 4, 6, 7, 10, 11, 12, 14, 15, 16, 17, 19, 20, 21, 22, X, and Y) represent HORs in these centromeres. (Figure continues on following pages.)
Figure 5.
Figure 5.
Inferring HORs for cen1, cen9, cen13, and cen18. (First row) Splitting an unbreakable junction monomer in cen1 results in two monomers with an 11-nt difference and transforms the monomer graph of cen1 into a cycle with a single chord. (Second row) The manually inferred HOR of cen9 (McNulty and Sullivan 2018), shown as the blue cycle, is in conflict with the CE postulate because the frequently traversed yellow cycle contains a monomer that does not belong to the blue cycle. (Third row) Splitting an unbreakable junction monomer in cen13 results in two similar monomers with an only 3-nt difference and transforms the monomer graph of cen13 (Fig. 4) into a cycle with a single chord shown on the left. The resulting simplified monomer graph (shown on the right) reveals the canonical 11-monomer HOR in cen13. (Fourth row) Splitting an unbreakable junction monomer in cen18 results in two monomers with only a single-nucleotide difference and transforms the simplified monomer graph of cen18 (Fig. 4) into a cycle with three chords (shown on the left). The resulting simplified monomer graph (shown on the right) reveals the canonical 12-monomer HOR in cen18. (Figure continues on following page.)
Figure 5.
Figure 5.
Inferring HORs for cen1, cen9, cen13, and cen18. (First row) Splitting an unbreakable junction monomer in cen1 results in two monomers with an 11-nt difference and transforms the monomer graph of cen1 into a cycle with a single chord. (Second row) The manually inferred HOR of cen9 (McNulty and Sullivan 2018), shown as the blue cycle, is in conflict with the CE postulate because the frequently traversed yellow cycle contains a monomer that does not belong to the blue cycle. (Third row) Splitting an unbreakable junction monomer in cen13 results in two similar monomers with an only 3-nt difference and transforms the monomer graph of cen13 (Fig. 4) into a cycle with a single chord shown on the left. The resulting simplified monomer graph (shown on the right) reveals the canonical 11-monomer HOR in cen13. (Fourth row) Splitting an unbreakable junction monomer in cen18 results in two monomers with only a single-nucleotide difference and transforms the simplified monomer graph of cen18 (Fig. 4) into a cycle with three chords (shown on the left). The resulting simplified monomer graph (shown on the right) reveals the canonical 12-monomer HOR in cen18. (Figure continues on following page.)
Figure 6.
Figure 6.
Dehybridization substitutes hybrid vertices (monomers) by hybrid edges in the monomer graph. (Top) Dehybridization of P5 and R1/5/19 in cen5. (Bottom) Dehybridization of L8 in cen8.
Figure 7.
Figure 7.
Decomposition of cenX into HORs. The 12-monomer HOR for cenX is represented as M1… M12 = AB…KL. The monomer set includes these 12 frequent monomers as well as hybrid monomers M (a hybrid of monomers J and H) and N (a hybrid of monomers K and J) identified in Dvorkina et al. (2020). Each occurrence of this HOR that starts from the monomer Mi is labeled as ci (shown in red). Each occurrence of a partial HOR that includes monomers from i to j is labeled as pi,j. We use the notation cm (pm) to denote m consecutive occurrences of a canonical (partial) HOR. The most frequent partial monomers p3-7, p7-3, and p5-2 in cenX are colored in blue, green, and brown, respectively. The HOR decomposition of cenX has a length 72 and includes 1486 complete HORs that form 34 HOR runs. Only 257 of 18,089 (1.4%) monomer blocks in cenX are not covered by complete HORs. The “LINE” entry shows the position of the LINE element. To ensure that all monomers are shown in the forward strand, we decompose the reverse complement of cenX and take reverse-complements of all monomers in cenX (Supplemental Note 4).
Figure 8.
Figure 8.
Two different “monocentromeres” BABABABABABCBCBCBCBCB and BABCBABCBABCBABCBABCB have the identical monomer graphs.

Similar articles

Cited by

References

    1. Ahuja RK, Magnati TL, Orlin JB. 1993. Network flows: theory, algorithms, and applications. Prentice-Hall, Upper Saddle River, NJ.
    1. Alexandrov I, Kazakov A, Tumeneva I, Shepelev V, Yurov Y. 2001. α-Satellite DNA of primates: old and new families. Chromosoma 110: 253–266. 10.1007/s004120100146 - DOI - PubMed
    1. Alkan C, Ventura M, Archidiacono N, Rocchi M, Sahinalp SC, Eichler EE. 2007. Organization and evolution of primate centromeric DNA from whole-genome shotgun sequence data. PLoS Comput Biol 3: e181. 10.1371/journal.pcbi.0030181 - DOI - PMC - PubMed
    1. Altemose N, Logsdon GA, Bzikadze AV, Sidhwani P, Langley SA, Caldas GV, Hoyt SJ, Uralsky L, Ryabov FD, Shew CJ, et al. 2022. Complete genomic and epigenetic maps of human centromeres. Science 376: eabl4178. 10.1126/science.abl4178 - DOI - PMC - PubMed
    1. Black EM, Giunta S. 2018. Repetitive fragile sites: centromere satellite DNA as a source of genome instability in human diseases. Genes (Basel) 9: 615. 10.3390/genes9120615 - DOI - PMC - PubMed

Publication types

LinkOut - more resources