

The Utility of Arterial Transit Time Measurement for Evaluating the Hemodynamic Perfusion State of Patients with Chronic Cerebrovascular Stenosis or Occlusive Disease: Correlative Study between MR Imaging and 15O-labeled H2O Positron Emission Tomography
- PMID: 35545508
- PMCID: PMC10449557
- DOI: 10.2463/mrms.mp.2020-0123
The Utility of Arterial Transit Time Measurement for Evaluating the Hemodynamic Perfusion State of Patients with Chronic Cerebrovascular Stenosis or Occlusive Disease: Correlative Study between MR Imaging and 15O-labeled H2O Positron Emission Tomography
Abstract
Purpose: To verify whether arterial transit time (ATT) mapping can correct arterial spin labeling-cerebral blood flow (ASL-CBF) values and to verify whether ATT is a parameter that correlates with positron emission tomography (PET)-oxygen extraction fraction (OEF) and PET-mean transit time (MTT).
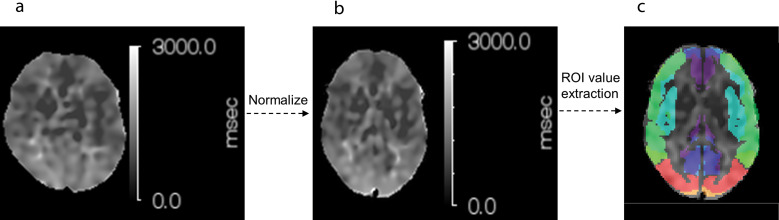
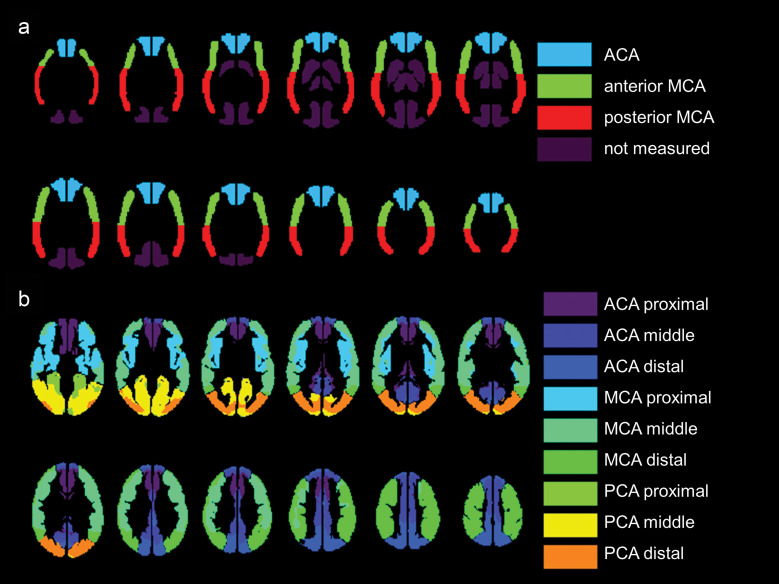
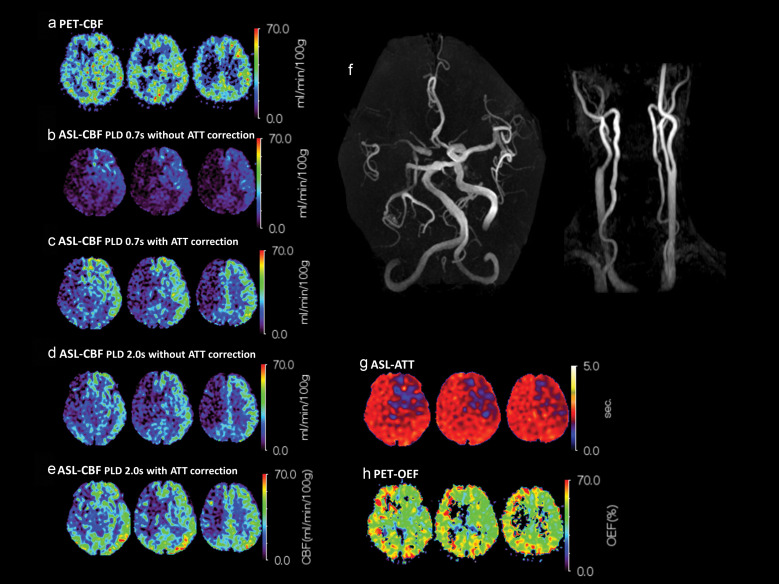
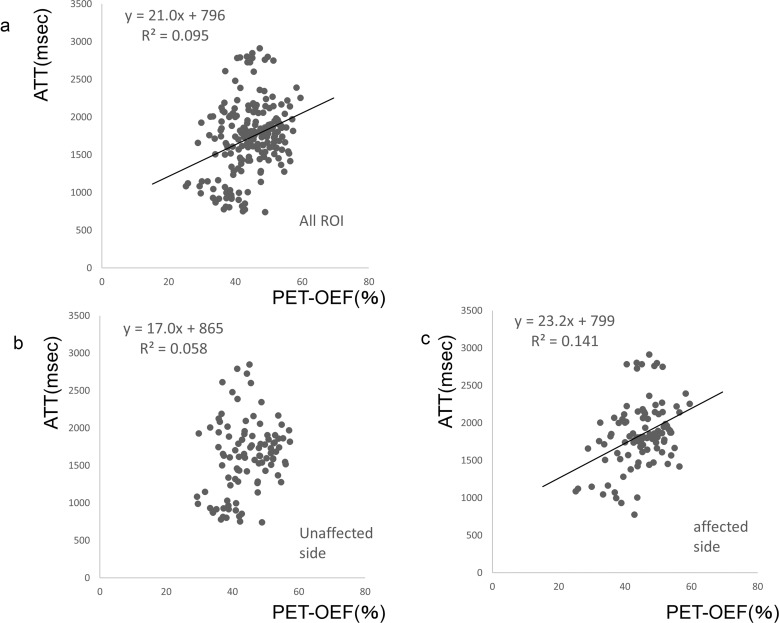
Methods: Eleven patients with unilateral major cerebral artery stenosis or occlusion underwent MRI and PET in the chronic or asymptomatic phase. ASL-MRI acquisitions were conducted with each of two post-label delay (PLD) settings (0.7s and 2.0s) using a pseudo-continuous ASL pulse sequence and 3D-spin echo spiral readout with vascular crusher gradient. ATT maps were obtained using a low-resolution pre-scan approach with five PLD settings. Using the ASL perfusion images and ATT mapping, ATT-corrected ASL-CBF images were obtained. Four kinds of ASL-CBF methods (PLD 0.7s with or without ATT correction and PLD 2.0s with or without ATT correction) were compared to PET-CBF, using vascular territory ROIs. ATT and OEF were compared for all ROIs, unaffected side ROIs, and affected side ROIs, respectively. ATT and MTT were compared by the ratio of the affected side to the unaffected side. Transit time-based ROIs were used for the comparison with ATT.
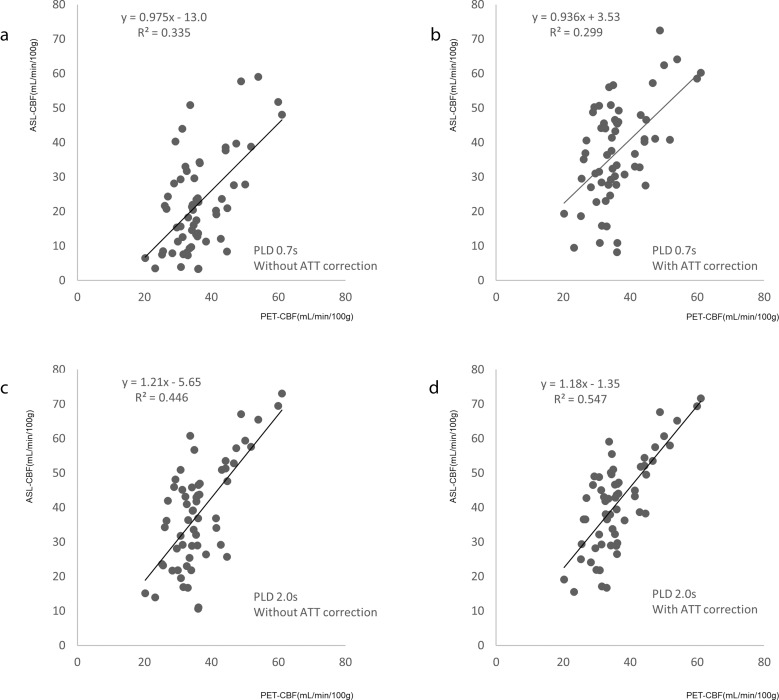
Results: Comparing ASL-CBF and PET-CBF, the correlation was higher with ATT correction than without correction, and for a PLD of 2.0s compared with 0.7s. The best correlation was for PLD of 2.0s with ATT correction (R2 = 0.547). ROIs on the affected side showed a low but significant correlation between ATT and PET-OEF (R2 = 0.141). There was a low correlation between the ATT ratio and the MTT ratio (R2 = 0.133).
Conclusion: Low-resolution ATT correction may increase the accuracy of ASL-CBF measurements in patients with unilateral major cerebral artery stenosis or occlusion. In addition, ATT itself might have a potential role in detecting compromised hemodynamic state.
Keywords: arterial spin labeling; arterial transit time; cerebral blood flow; magnetic resonance imaging; oxygen extraction fraction.
Conflict of interest statement
Naoyuki Takei is an employee of GE Healthcare Japan Corporation. The other authors have no potential conflicts of interest with respect to the research of this article.
Figures
References
-
- Detre JA, Leigh JS, Williams DS, Koretsky AP. Perfusion imaging. Magn Reson Med 1992; 23:37–45. - PubMed
-
- Alsop DC, Detre JA. Multisection cerebral blood flow MR imaging with continuous arterial spin labeling. Radiology 1998; 208:410–416. - PubMed
-
- Chalela JA, Alsop DC, Gonzalez-Atavales JB, Maldjian JA, Kasner SE, Detre JA. Magnetic resonance perfusion imaging in acute ischemic stroke using continuous arterial spin labeling. Stroke 2000; 31:680–687. - PubMed
-
- Detre JA, Alsop DC, Vives LR, Maccotta L, Teener JW, Raps EC, et al. Noninvasive MRI evaluation of cerebral blood flow in cerebrovascular disease. Neurology 1998; 50:633–641. - PubMed