

High-resolution crystal structure of a 20 kDa superfluorinated gold nanocluster
- PMID: 35545611
- PMCID: PMC9095690
- DOI: 10.1038/s41467-022-29966-2
High-resolution crystal structure of a 20 kDa superfluorinated gold nanocluster
Abstract
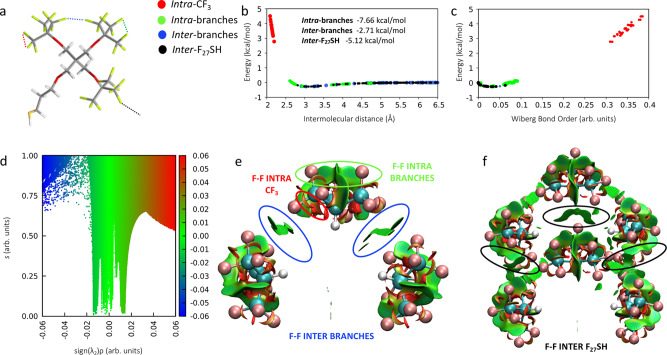
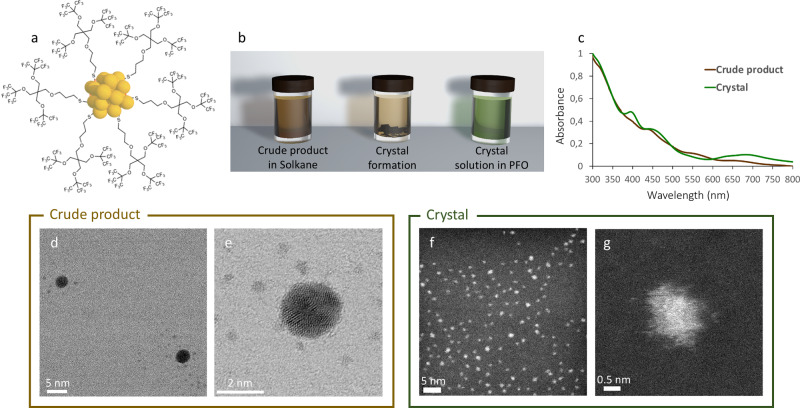
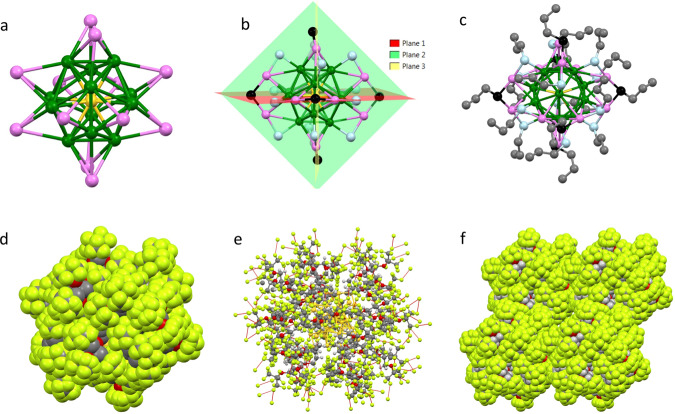
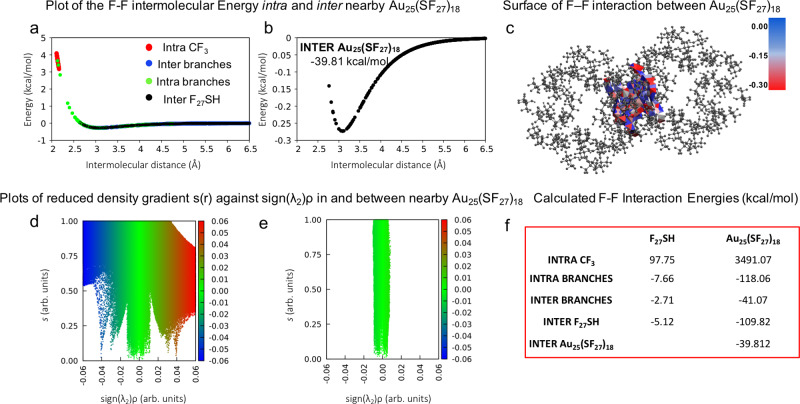
Crystallization of atomically precise nanoclusters is gaining increasing attention, due to the opportunity of elucidating both intracluster and intercluster packing modes, and exploiting the functionality of the resulting highly pure crystallized materials. Herein, we report the design and single-crystal X-ray structure of a superfluorinated 20 kDa gold nanocluster, with an Au25 core coated by a shell of multi-branched highly fluorinated thiols (SF27) resulting in almost 500 fluorine atoms, i.e., ([Au25(SF27)18]0). The cluster shows a switchable solubility in the fluorous phase. X-ray analysis and computational studies reveal the key role of both intracluster and intercluster F···F contacts in driving [Au25(SF27)18]0 crystal packing and stabilization, highlighting the ability of multi-branched fluorinated thiols to endow atomically precise nanoclusters with remarkable crystallogenic behavior.
© 2022. The Author(s).
Conflict of interest statement
The authors declare no competing interests.
Figures
Similar articles
-
Highly Robust but Surface-Active: An N-Heterocyclic Carbene-Stabilized Au25 Nanocluster.Angew Chem Int Ed Engl. 2019 Dec 2;58(49):17731-17735. doi: 10.1002/anie.201908983. Epub 2019 Oct 23. Angew Chem Int Ed Engl. 2019. PMID: 31517436 Review.
-
Dehydration of phenylboronic acid to boroxine catalyzed by Au(n) nanoclusters with atom packing core-shell structure.J Nanosci Nanotechnol. 2013 Jul;13(7):5088-92. doi: 10.1166/jnn.2013.7577. J Nanosci Nanotechnol. 2013. PMID: 23901534
-
Electrochemistry of Atomically Precise Metal Nanoclusters.Acc Chem Res. 2019 Jan 15;52(1):12-22. doi: 10.1021/acs.accounts.8b00379. Epub 2018 Nov 30. Acc Chem Res. 2019. PMID: 30500153
-
Superatomic Au25(SC2H5)18 Nanocluster under Pressure.ACS Nanosci Au. 2021 Oct 26;2(1):40-48. doi: 10.1021/acsnanoscienceau.1c00024. eCollection 2022 Feb 16. ACS Nanosci Au. 2021. PMID: 37101514 Free PMC article.
-
Au25(SR)18: the captain of the great nanocluster ship.Nanoscale. 2018 Jun 14;10(23):10758-10834. doi: 10.1039/c8nr02973c. Nanoscale. 2018. PMID: 29873658 Review.
Cited by
-
The Recent Development of Multifunctional Gold Nanoclusters in Tumor Theranostic and Combination Therapy.Pharmaceutics. 2022 Nov 14;14(11):2451. doi: 10.3390/pharmaceutics14112451. Pharmaceutics. 2022. PMID: 36432642 Free PMC article. Review.
-
Self-Assembly and Biological Properties of Highly Fluorinated Oligonucleotide Amphiphiles.Angew Chem Int Ed Engl. 2025 Feb 10;64(7):e202419996. doi: 10.1002/anie.202419996. Epub 2024 Dec 17. Angew Chem Int Ed Engl. 2025. PMID: 39636686 Free PMC article.
-
Theranostic and Combined Approaches Exploiting Multifunctional Gold Nanoclusters in Tumoral Ecosystems: A Paradigm Shift in Precision Oncology.Curr Radiopharm. 2024;17(4):330-340. doi: 10.2174/0118744710283369240328082442. Curr Radiopharm. 2024. PMID: 38571350 Review.
-
Synthesis and Characterization of Ultra-Small Gold Nanoparticles in the Ionic Liquid 1-Ethyl-3-methylimidazolium Dicyanamide, [Emim][DCA].ChemistryOpen. 2024 Feb;13(2):e202300106. doi: 10.1002/open.202300106. Epub 2023 Aug 31. ChemistryOpen. 2024. PMID: 37650312 Free PMC article.
References
-
- Doud EA, et al. Superatoms in materials science. Nat. Rev. Mater. 2020;5:371–387. doi: 10.1038/s41578-019-0175-3. - DOI
Grants and funding
LinkOut - more resources
Full Text Sources
