

The impact of digital media on children's intelligence while controlling for genetic differences in cognition and socioeconomic background
- PMID: 35545630
- PMCID: PMC9095723
- DOI: 10.1038/s41598-022-11341-2
The impact of digital media on children's intelligence while controlling for genetic differences in cognition and socioeconomic background
Abstract
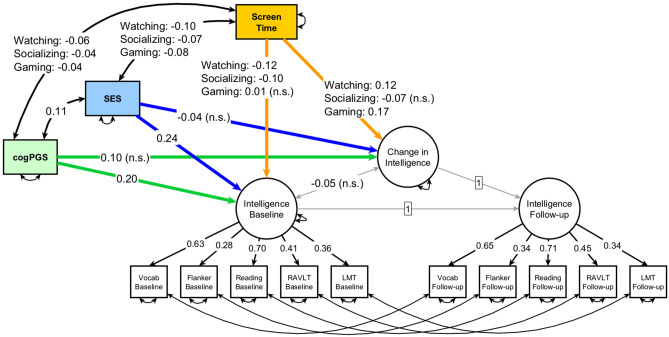
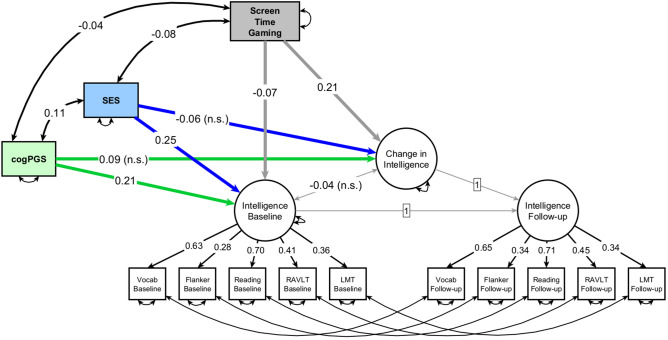
Digital media defines modern childhood, but its cognitive effects are unclear and hotly debated. We believe that studies with genetic data could clarify causal claims and correct for the typically unaccounted role of genetic predispositions. Here, we estimated the impact of different types of screen time (watching, socializing, or gaming) on children's intelligence while controlling for the confounding effects of genetic differences in cognition and socioeconomic status. We analyzed 9855 children from the USA who were part of the ABCD dataset with measures of intelligence at baseline (ages 9-10) and after two years. At baseline, time watching (r = - 0.12) and socializing (r = - 0.10) were negatively correlated with intelligence, while gaming did not correlate. After two years, gaming positively impacted intelligence (standardized β = + 0.17), but socializing had no effect. This is consistent with cognitive benefits documented in experimental studies on video gaming. Unexpectedly, watching videos also benefited intelligence (standardized β = + 0.12), contrary to prior research on the effect of watching TV. Although, in a posthoc analysis, this was not significant if parental education (instead of SES) was controlled for. Broadly, our results are in line with research on the malleability of cognitive abilities from environmental factors, such as cognitive training and the Flynn effect.
© 2022. The Author(s).
Conflict of interest statement
The authors declare no competing interests.
Figures

Similar articles
-
Associations of American Indian children's screen-time behavior with parental television behavior, parental perceptions of children's screen time, and media-related resources in the home.Prev Chronic Dis. 2011 Sep;8(5):A105. Epub 2011 Aug 15. Prev Chronic Dis. 2011. PMID: 21843408 Free PMC article.
-
Parental psychological problems were associated with higher screen time and the use of mature-rated media in children.Acta Paediatr. 2022 Apr;111(4):825-833. doi: 10.1111/apa.16253. Epub 2022 Jan 31. Acta Paediatr. 2022. PMID: 35023210 Free PMC article.
-
Associations between children's socioeconomic status, weight status, and sex, with screen-based sedentary behaviours and sport participation.Int J Pediatr Obes. 2009;4(4):299-305. doi: 10.3109/17477160902811215. Int J Pediatr Obes. 2009. PMID: 19922045
-
Understanding Digital Dementia and Cognitive Impact in the Current Era of the Internet: A Review.Cureus. 2024 Sep 23;16(9):e70029. doi: 10.7759/cureus.70029. eCollection 2024 Sep. Cureus. 2024. PMID: 39449887 Free PMC article. Review.
-
Television and children's executive function.Adv Child Dev Behav. 2015;48:219-48. doi: 10.1016/bs.acdb.2014.11.006. Epub 2015 Jan 23. Adv Child Dev Behav. 2015. PMID: 25735946 Review.
Cited by
-
Associations between meeting 24h movement behavior guidelines and cognition, gray matter volume, and academic performance in children and adolescents: a systematic review.Arch Public Health. 2025 Jan 10;83(1):10. doi: 10.1186/s13690-024-01493-0. Arch Public Health. 2025. PMID: 39794834 Free PMC article.
-
Brain structural co-development is associated with internalizing symptoms two years later in the ABCD cohort.J Behav Addict. 2023 Mar 20;12(1):80-93. doi: 10.1556/2006.2023.00006. Print 2023 Mar 30. J Behav Addict. 2023. PMID: 36940096 Free PMC article.
-
A crowding free digital interface to help French-speaking children learn to read.PLoS One. 2025 Jun 25;20(6):e0323623. doi: 10.1371/journal.pone.0323623. eCollection 2025. PLoS One. 2025. PMID: 40560962 Free PMC article.
-
Intelligence-Dependent Differential Effects of Media Exposure on Executive Function Changes in Children: A Population-Based Cohort Study With a Longitudinal Design.J Korean Med Sci. 2023 Dec 11;38(48):e411. doi: 10.3346/jkms.2023.38.e411. J Korean Med Sci. 2023. PMID: 38084030 Free PMC article.
-
Effect of the Use of Electronic Media on the Cognitive Intelligence, Attention, and Academic Trajectory of Medical Students.Cureus. 2025 Feb 23;17(2):e79513. doi: 10.7759/cureus.79513. eCollection 2025 Feb. Cureus. 2025. PMID: 40135005 Free PMC article.
References
-
- Ofcom. Children and Parents: Media Use and Attitudes Report 2015. http://stakeholders.ofcom.org.uk/market-data-research/other/research-pub... (2015).
-
- AACAP. Screen Time and Children. https://www.aacap.org/AACAP/Families_and_Youth/Facts_for_Families/FFF-Gu... (2020).
Publication types
MeSH terms
Grants and funding
- U24 DA041147/DA/NIDA NIH HHS/United States
- U01 DA051039/DA/NIDA NIH HHS/United States
- U01 DA041120/DA/NIDA NIH HHS/United States
- U01 DA051018/DA/NIDA NIH HHS/United States
- U01 DA041093/DA/NIDA NIH HHS/United States
- U24 DA041123/DA/NIDA NIH HHS/United States
- U01 DA051038/DA/NIDA NIH HHS/United States
- U01 DA051037/DA/NIDA NIH HHS/United States
- U01 DA051016/DA/NIDA NIH HHS/United States
- U01 DA041106/DA/NIDA NIH HHS/United States
- U01 DA041117/DA/NIDA NIH HHS/United States
- U01 DA041148/DA/NIDA NIH HHS/United States
- U01 DA041174/DA/NIDA NIH HHS/United States
- U01 DA041134/DA/NIDA NIH HHS/United States
- U01 DA041022/DA/NIDA NIH HHS/United States
- U01 DA041156/DA/NIDA NIH HHS/United States
- U01 DA050987/DA/NIDA NIH HHS/United States
- U01 DA041025/DA/NIDA NIH HHS/United States
- U01 DA050989/DA/NIDA NIH HHS/United States
- U01 DA041089/DA/NIDA NIH HHS/United States
- U01 DA050988/DA/NIDA NIH HHS/United States
- U01 DA041028/DA/NIDA NIH HHS/United States
- U01 DA041048/DA/NIDA NIH HHS/United States
LinkOut - more resources
Full Text Sources
