. 2022 May 11;13(1):2602.
doi: 10.1038/s41467-022-30352-1.

Activation of Xist by an evolutionarily conserved function of KDM5C demethylase

Affiliations

Activation of Xist by an evolutionarily conserved function of KDM5C demethylase

Milan Kumar Samanta et al. Nat Commun. .

Abstract

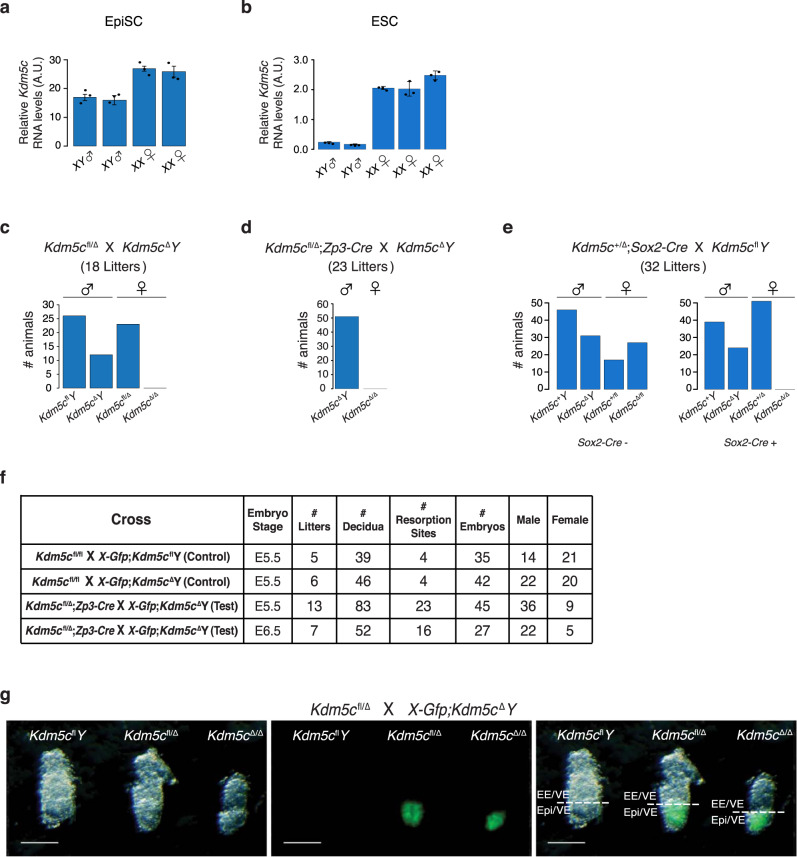
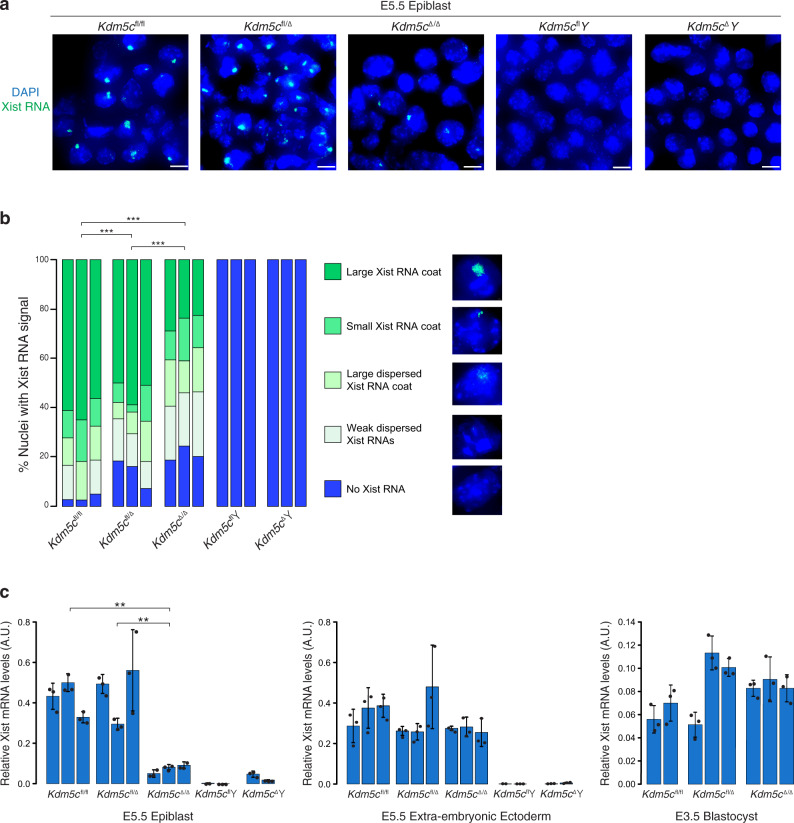
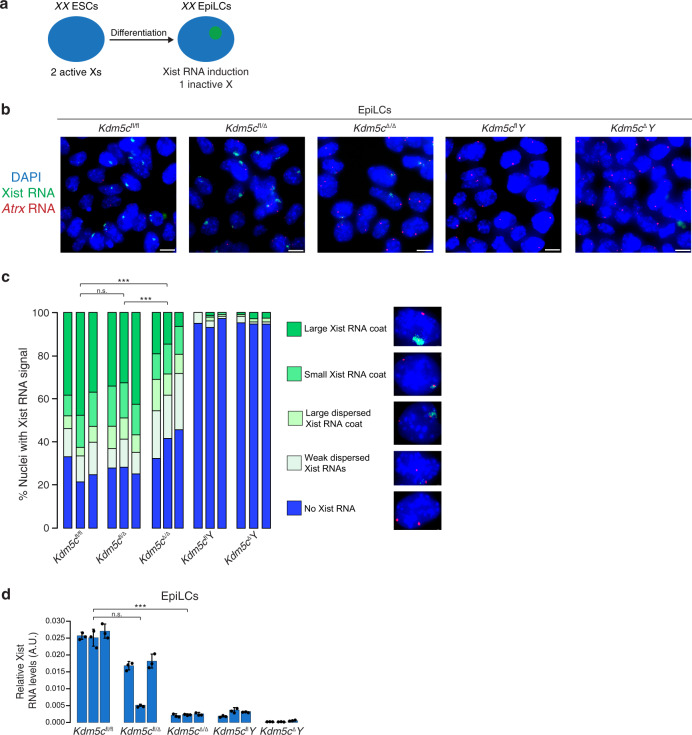
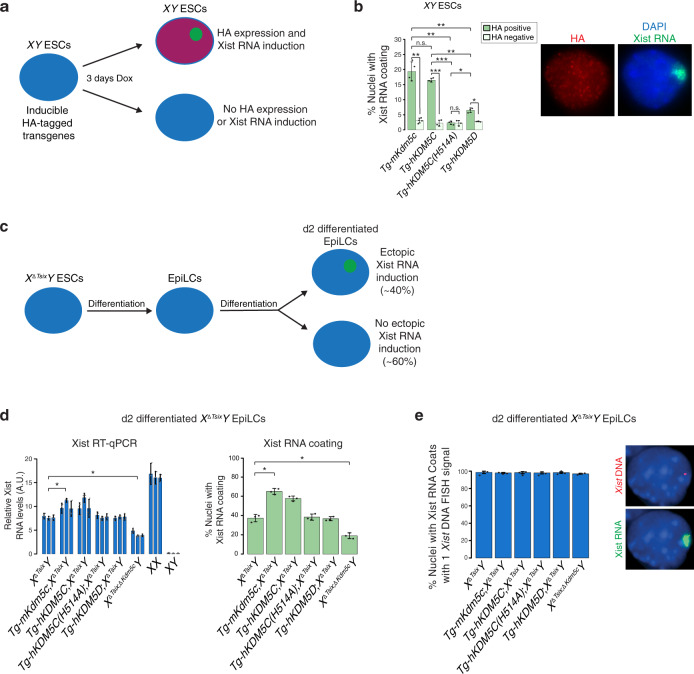
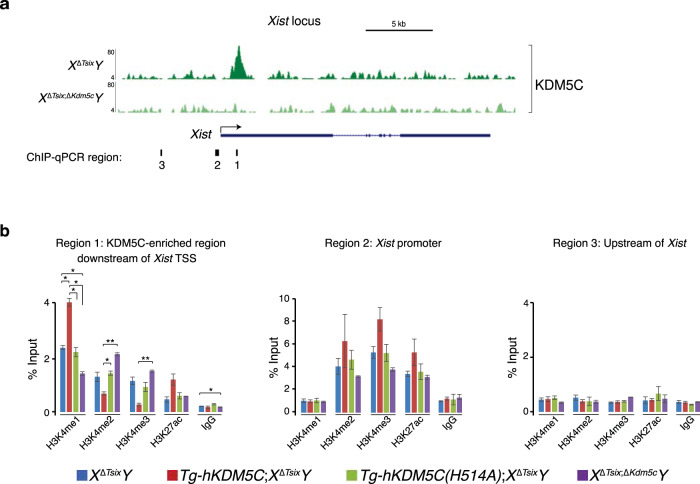
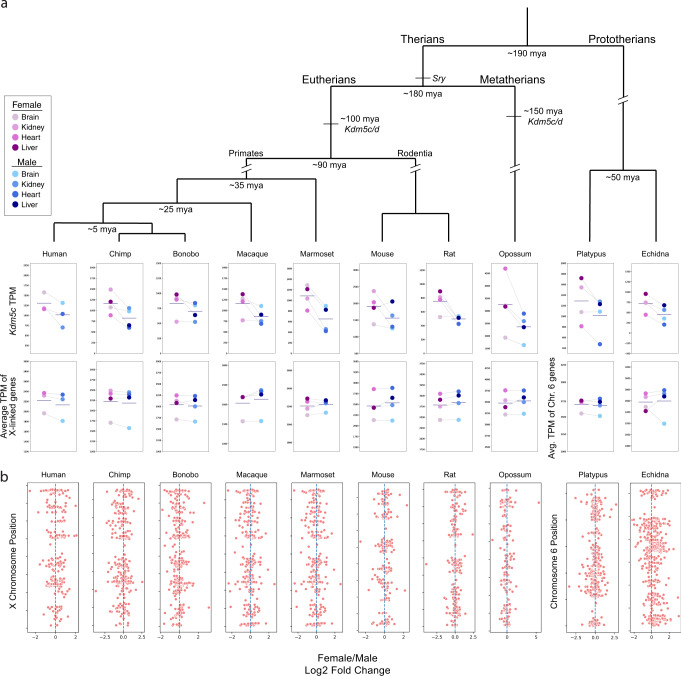
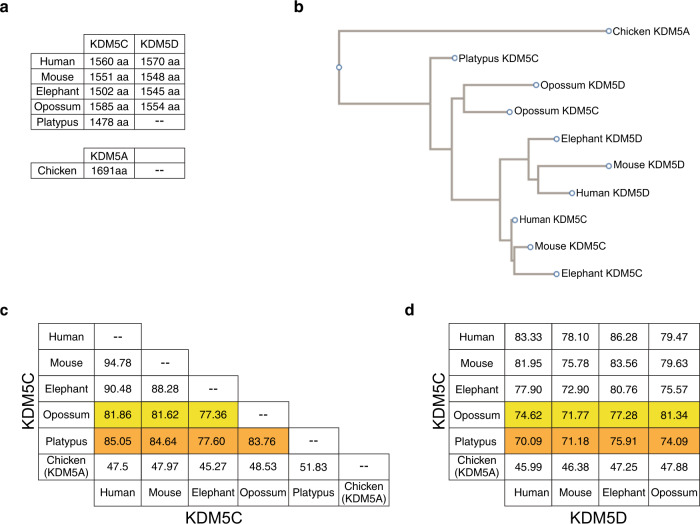
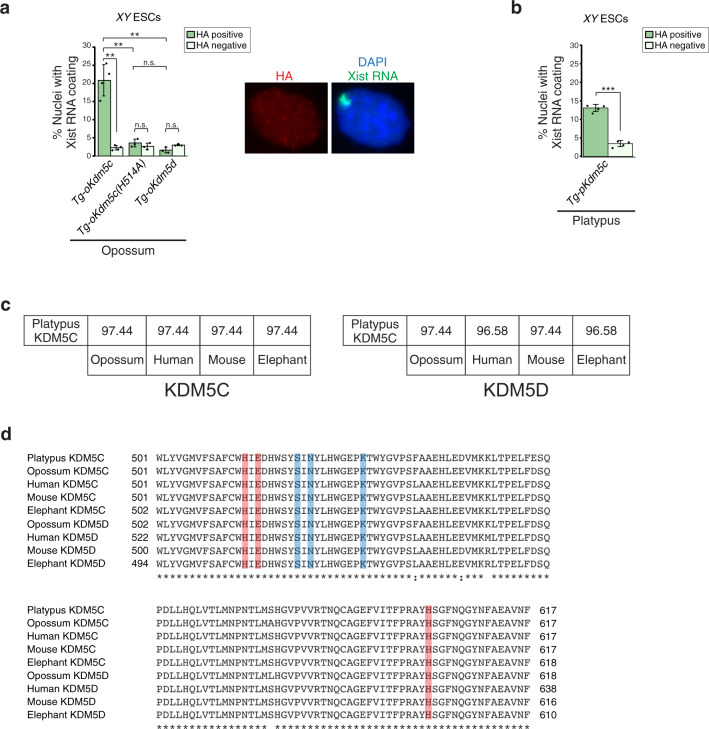
XX female and XY male therian mammals equalize X-linked gene expression through the mitotically-stable transcriptional inactivation of one of the two X chromosomes in female somatic cells. Here, we describe an essential function of the X-linked homolog of an ancestral X-Y gene pair, Kdm5c-Kdm5d, in the expression of Xist lncRNA, which is required for stable X-inactivation. Ablation of Kdm5c function in females results in a significant reduction in Xist RNA expression. Kdm5c encodes a demethylase that enhances Xist expression by converting histone H3K4me2/3 modifications into H3K4me1. Ectopic expression of mouse and human KDM5C, but not the Y-linked homolog KDM5D, induces Xist in male mouse embryonic stem cells (mESCs). Similarly, marsupial (opossum) Kdm5c but not Kdm5d also upregulates Xist in male mESCs, despite marsupials lacking Xist, suggesting that the KDM5C function that activates Xist in eutherians is strongly conserved and predates the divergence of eutherian and metatherian mammals. In support, prototherian (platypus) Kdm5c also induces Xist in male mESCs. Together, our data suggest that eutherian mammals co-opted the ancestral demethylase KDM5C during sex chromosome evolution to upregulate Xist for the female-specific induction of X-inactivation.


Conflict of interest statement

The authors declare no competing interests.

Figures

Fig. 1
Fig. 1. Lethality of Kdm5cΔ/Δ female embryos.
a, b Relative quantification of Kdm5c RNA levels in wild-type XX female and XY male EpiSCs (a) and ESCs (b) by RT-qPCR. Each bar in the graph represents an individual cell line analyzed by RT-qPCR in triplicate. Data are presented as mean ± standard deviation between technical replicates. cf Quantification of liveborn mice (ce) and recovery of embryonic day (E) 5.5 and 6.5 embryos (f). g Representative micrographs of E5.5 embryos. 13 litters were analyzed with similar results. Scale bars, 50 μm. Expression of a paternally-inherited X-Gfp transgene marks female embryonic epiblasts (Epi) but not extraembryonic ectoderm (EE) or visceral endoderm (VE) due to random X-inactivation in the epiblast lineage and imprinted X-inactivation of the paternal X-chromosome in extraembryonic lineages,. See also Supplementary Fig. 1a. Source data are provided as a Source Data file.
Fig. 2
Fig. 2. Reduced Xist RNA expression in Kdm5cΔ/Δ female embryos.
a Strand-specific RNA FISH detection of Xist RNA in representative E5.5 embryonic epiblast cells. Nuclei are stained blue with DAPI. Scale bars, 10μm. RNA FISH analysis was performed on 3 embryos/genotype with similar results. b Quantification of Xist RNA-coated nuclei in the E5.5 epiblast cells. Number of nuclei counted in each of the three embryos/genotype: Kdm5cfl/fl, n = 36, 77, and 80; Kdm5cfl/Δ, n = 76, 68, and 55; Kdm5cΔ/Δ, n = 128, 139, and 84; Kdm5cflY, n = 150, 200, and 100; Kdm5cΔY, n = 100, 93, and 85. P values, Chi-square test between female genotypes. *P ≤ 0.05; **P < 0.01; ***P < 0.001. See Supplementary Table 1 for Welch’s two-sided t test for all pairwise statistical comparisons. c Relative quantification of Xist RNA by RT-qPCR in E5.5 epiblasts, E5.5 extra-embryonic ectoderm, and E3.5 embryos. Each bar in the graph represents an individual E5.5 embryo fragment or E3.5 embryo analyzed by RT-qPCR in triplicate. Data are presented as mean ± standard deviation between technical replicates. P values, Welch’s two-sided t test on ΔCt values of biological replicates. *P ≤ 0.05; **P < 0.01; ***P < 0.001. Selected pairwise comparisons are shown. See Supplementary Table 2 for all pairwise statistical comparisons. See also Supplementary Fig. 1b. Source data are provided as a Source Data file.
Fig. 3
Fig. 3. Reduced Xist RNA expression in Kdm5cΔ/Δ female epiblast-like cells (EpiLCs).
a Schematic of induction of X-inactivation upon differentiation of ESCs into EpiLCs. See also Supplementary Fig. 2a. b Detection of Xist RNA (green) by strand-specific FISH together with Atrx RNA (red) in representative EpiLCs. Scale bars, 10 μm. Three independent ESC lines were differentiated into EpiLCs/genotype with similar results. c Quantification of Xist RNA coating in EpiLCs. Xist RNA expression was quantified in five categories. Numbers of nuclei counted in EpiLCs differentiated from each of three independent ESC lines/genotype: Kdm5cfl/fl, n = 154, 122, and 113; Kdm5cfl/Δ, n = 107, 140, and 130; Kdm5cΔ/Δ, n = 145, 163, and 151; Kdm5cflY, n = 124, 230, and 111; Kdm5cΔY, n = 110, 138, and 114. P values, Chi-square analysis between female genotypes. n.s. not significant; *P ≤ 0.05; **P < 0.01; ***P < 0.001. See Supplementary Table 3 for Welch’s two-sided t test on all pairwise statistical comparisons. d Quantification of relative Xist RNA levels by RT-qPCR in the EpiLCs. Three independent ESC lines were differentiated into EpiLCs/genotype. Each bar in graph represents an individual ESC line differentiated into EpiLCs for each genotype. Data are presented as mean ± standard deviation between technical PCR replicates. P values, Welch’s two-sided t test on ΔCt values of biological replicates. n.s. not significant; *P ≤ 0.05; **P < 0.01; ***P < 0.001. See Supplementary Table 4 for all pairwise statistical comparisons. See also Supplementary Fig. 2b. Source data are provided as a Source Data file.
Fig. 4
Fig. 4. Ectopic KDM5C expression induces Xist in male ESCs.
a Schematic of ectopic expression of HA-tagged transgenes in XY male ESCs. b Quantification of nuclei with Xist RNA coating in transgenic (Tg) XY male ESC lines (n = 3) expressing HA-tagged mouse KDM5C (Tg-mKdm5c; n = 292, 437, and 210); human KDM5C (Tg-hKDM5C; n = 154, 212, and 184); enzymatically inactive KDM5C (Tg-hKDM5C(H514A); n = 292, 295, and 316); and, KDM5D (Tg-hKDM5D; n = 262, 222, and 232) proteins. Representative nuclei with IF detection of the HA epitope tag (red) coupled with FISH detection of Xist RNA (green) in the XY male ESCs. Data are presented as mean ± SEM. P values, Welch’s two-sided t test. n.s., not significant; *P ≤ 0.05; **P < 0.01; ***P < 0.001. See Supplementary Table 5 for all pairwise statistical comparisons. c Schematic of ectopic Xist RNA induction in day (d) 2 differentiated XΔTsixY male ESCs. See also Supplementary Fig. 2c, d. d Quantification of ectopic Xist RNA expression by RT-qPCR (left) and Xist RNA-coated nuclei by RNA FISH (right) in d2 differentiated XΔTsixY EpiLCs ectopically expressing mouse KDM5C (Tg-mKdm5c;XΔTsixY); human KDM5C (Tg-hKDM5C;XΔTsixY); enzymatically inactive KDM5C (Tg-hKDM5C(H514A);XΔTsixY); KDM5D (Tg-hKDM5D;XΔTsixY); and, XΔTsixY EpiLCs lacking KDM5C (XΔTsixKdm5cY). For both the Xist RNA FISH and the Xist RT-qPCR data, three independent ESC lines/genotype were differentiated into d2 differentiated EpiLCs/genotype. For Xist RNA coating analysis, n = 100 nuclei per sample. Data are presented as mean ± SEM. For RT-qPCR, each sample was analyzed in triplicate. Data are presented as mean ± standard deviation between technical replicates. P values, Welch’s two-sided t test on ΔCt values of biological replicates. *P ≤ 0.05; **P < 0.01; ***P < 0.001. See Supplementary Table 6 for all pairwise statistical comparisons. e DNA FISH following RNA FISH demonstrates the presence of one X chromosome in nuclei with ectopic Xist RNA coating in the differentiated EpiLCs. n = 100 nuclei from three independent ESC lines differentiated into EpiLCs/genotype. Data are presented as mean ± SEM. See also Supplementary Fig. 3. Source data are provided as a Source Data file.
Fig. 5
Fig. 5. KDM5C upregulation of Xist expression via putative enhancer activation.
a KDM5C enrichment at the Xist locus detected by ChIP-Seq. See Supplementary Table 7 for ChIP-seq read quantification. b ChIP-qPCR quantification of H3K4me1, H3K4me2, H3K4me3, and H3K27ac enrichment at the Xist locus. Locations of PCR amplicons are denoted beneath the browser views in (a). ChIPs were performed on day 2 differentiated EpiLCs generated from two independent ESC lines/genotype. qPCRs were performed in triplicate for each ChIP sample. Data are presented as mean ± SEM between ChIP replicates. Selected pairwise comparisons are shown. *P ≤ 0.05; **P < 0.01; ***P < 0.001, Welch’s two-sided t tests. See Supplementary Table 8 for all pairwise statistical comparisons. Source data are provided as a Source Data file.
Fig. 6
Fig. 6. Phylogeny of Kdm5c/d and increased expression of Kdm5c in females vs. males in therian mammals.
a Inferred phylogeny of Kdm5c/d during mammalian evolution,,. Top row, Kdm5c transcript per million (TPM) levels in four tissues, as indicated, in females vs. males for seven eutherian species, one metatherian (marsupial) species (opossum), and two prototherian (monotreme) species (platypus and echidna). Bottom row, average TPM of all X-linked genes in females vs. males in the same tissues analyzed for Kdm5c expression. Platypus and echidna TPM averages are from Chromosome (Chr) 6, where KDM5C maps in those species. The dark gray horizontal line in all plots represents the mean of all tissues. Light gray lines connect corresponding tissue types between males and females. b Distribution of female:male expression of genes across the therian X chromosome or monotreme Chr 6. Each dot is the log2 fold change of a gene’s expression in females vs males and was calculated from the average of that gene’s TPM in the brain, heart, kidney, and liver; human plot includes expression from the brain, heart, and kidney. See Supplementary Data 1–12 for sequencing data from each species.
Fig. 7
Fig. 7. Divergence of KDM5C/D proteins during mammalian evolution.
a Amino acid chain length of the KDM5C and KDM5D proteins. b Multiple sequence alignment phylogeny of KDM5C/KDM5D amino acid sequences using a neighbor-joining algorithm. c, d Percent amino acid identity between therian, opossum, and platypus KDM5C proteins (c) and between KDM5C and KDM5D proteins (d).
Fig. 8
Fig. 8. Opossum and platypus KDM5C activate Xist in male mouse ESCs.
a Quantification of nuclei with Xist RNA coating in each of three independent transgenic (Tg) XY ESC lines expressing HA-tagged opossum KDM5C (Tg-oKdm5c; n = 209, 618, and 306); enzymatically inactive KDM5C protein (Tg-oKdm5c(H514A); n = 196, 206, and 193); and, KDM5D (Tg-oKdm5d; n = 803, 562, and 636). Data are presented as mean ± SEM. P values, Welch’s two-sided t test. n.s., not significant; *P ≤ 0.05; **P < 0.01; ***P < 0.001. See Supplementary Table 9 for all pairwise statistical comparisons. b Quantification of nuclei with Xist RNA coating in each of three independent transgenic (Tg) XY ESC lines expressing HA-tagged platypus KDM5C (Tg-pKdm5c; n = 202, 178, and 525). Data are presented as mean ± SEM. P values, Welch’s two-sided t test. ***P < 0.001. See Supplementary Table 9 for pairwise statistical comparisons. c Percent amino acid identity between the catalytic JmjC domain of platypus KDM5C and therian KDM5C (left) or platypus KDM5C and therian KDM5D proteins (right). d Multiple sequence alignment of the demethylase JmjC domain of KDM5C and KDM5D proteins. The predicted iron-binding and the α-ketoglutarate-binding amino acids required for the catalytic activity of KDM5C/D are shown in orange and blue,,,, respectively. Source data are provided as a Source Data file.

Similar articles

Cited by

References

    1. Bellott DW, Page DC. Reconstructing the evolution of vertebrate sex chromosomes. Cold Spring Harb. Symp. Quant. Biol. 2009;74:345–353. doi: 10.1101/sqb.2009.74.048. - DOI - PubMed
    1. Graves JA. Evolution of vertebrate sex chromosomes and dosage compensation. Nat. Rev. Genet. 2016;17:33–46. doi: 10.1038/nrg.2015.2. - DOI - PubMed
    1. Ohno, S. In Sex Chromosomes and Sex-linked Genes, x, 192 (Springer-Verlag, 1967).
    1. Lahn BT, Page DC. Four evolutionary strata on the human X chromosome. Science. 1999;286:964–967. doi: 10.1126/science.286.5441.964. - DOI - PubMed
    1. Lyon MF. Gene action in the X-chromosome of the mouse (Mus musculus L.) Nature. 1961;190:372–373. doi: 10.1038/190372a0. - DOI - PubMed

Publication types